
If your site is slow and takes too long to load, the issue could stem from several factors.
In this tutorial, we will explore the main causes of a slow site, how to diagnose problems on your site, and what solutions you can implement.
Table of Contents
Why is a site slow?
A site’s loading speed depends on various factors.
- Server performance: The number of simultaneous requests can overload the server if there are not enough resources allocated (e.g., CPU and RAM).
- Server configuration: Failure to optimize web server (Apache, Nginx) or database (MySQL, PostgreSQL) settings.
- Non-optimized site code: This could include poorly optimized PHP, JavaScript, or CSS scripts, or running complex queries to the database.
- External resources: Use of APIs, third-party plugins, or content served by CDN servers with slow response times.
In some cases, slow loading may also be due to network issues, such as when users are accessing the site via slow or unstable connections, especially if they are geographically distant from the server.
To rule out network issues or problems with your device, try accessing the site from a different device or Internet connection, or use one of the tools mentioned below to test site speed from different locations.
Identifying what is slowing down the site
To understand what is causing the high load time, it’s important to analyze the site speed using a specific tool and check both error and access logs for any issues.
Measuring site performance
You can use performance monitoring tools to get a detailed look at load times and the resources being loaded on the site.
Here are some tools you can use:
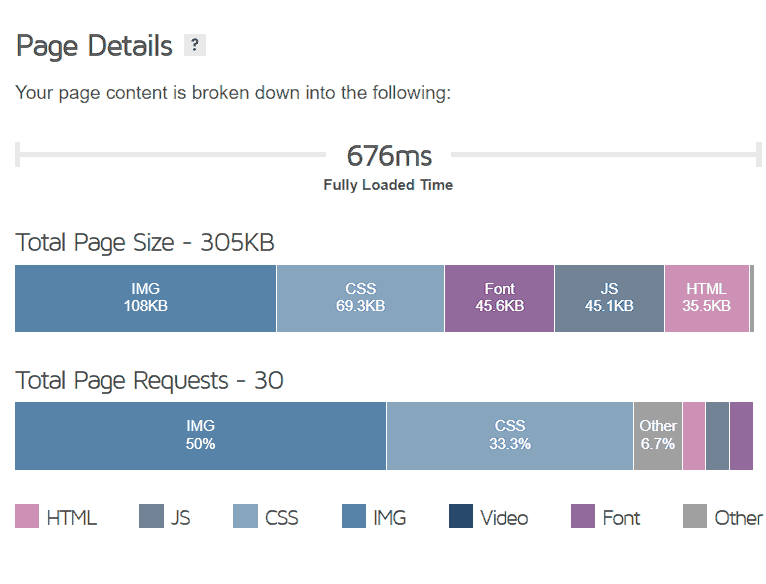
- Browser’s “network” tab: This allows you to see the number of resources being loaded and the page size.

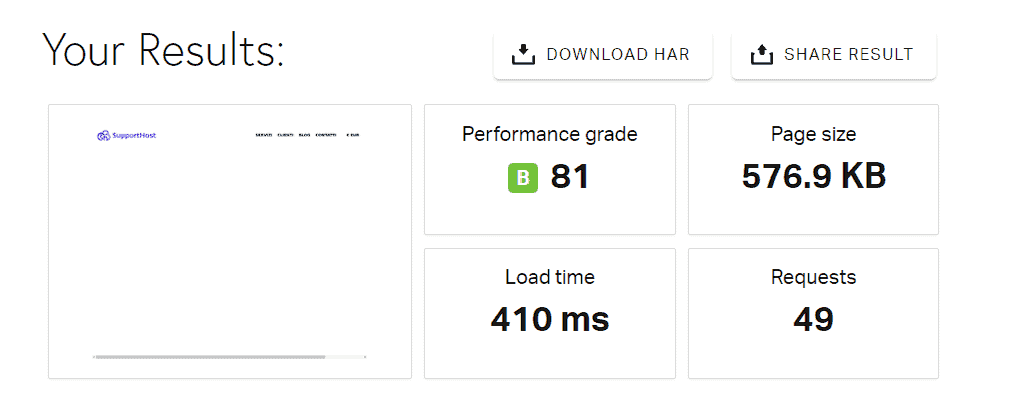
- GTmetrix: Analyzes website performance, offering a detailed evaluation of loading times, page size, and optimization suggestions. The free version currently allows 5 tests per month.
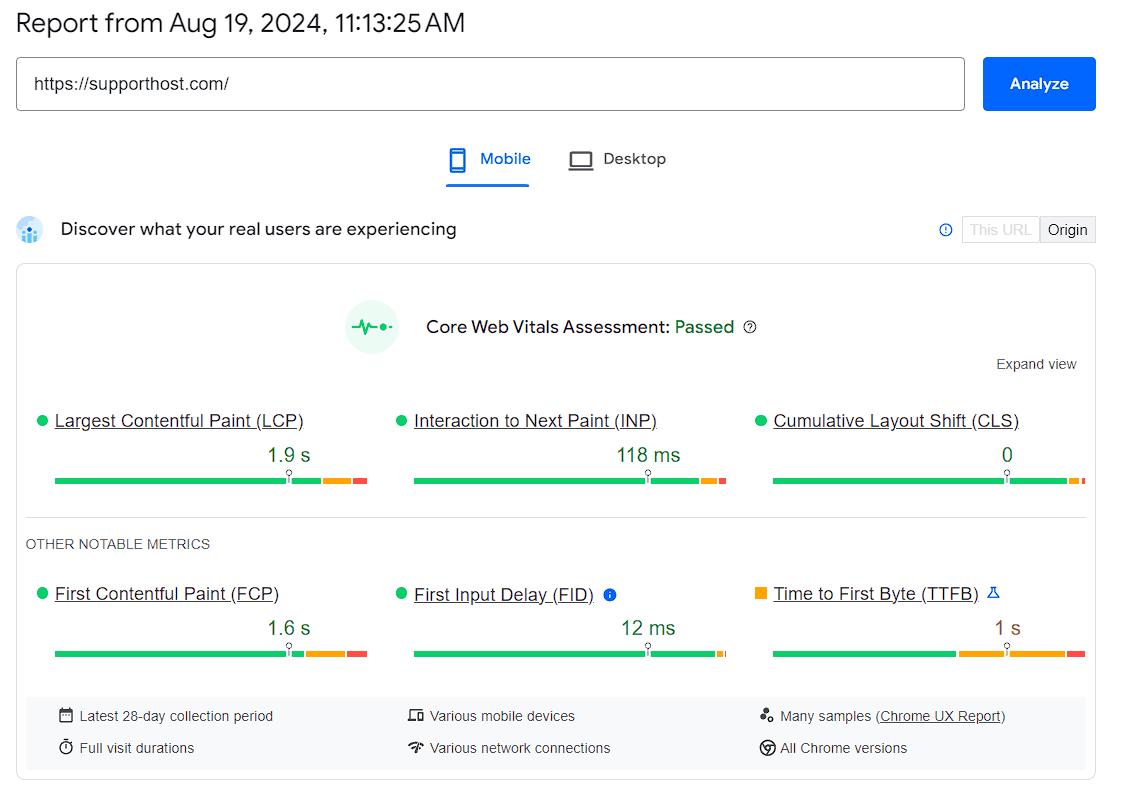
- Google PageSpeed Insights: Evaluates website performance with detailed loading information, especially from mobile devices.
- Pingdom: Conducts website load tests from different geographic locations to identify slow response times and potential blockages.
- WebPageTest: Provides a detailed view of page loading, including time to first byte (TTFB), rendering, and resource load times.

Using these tools, you can estimate load time, page size, and the number of requests. If the page size and the number of requests are high, the loading time will increase.
Optimizations will depend on the site itself. For example, if you’re working with a WordPress site, you can follow guides specific to WordPress optimization.
Checking the logs
Another useful step is to check the site’s logs.
Checking the logs can help you:
- Detect repeated accesses (e.g., by bots) that could slow down the site.
- Find errors.
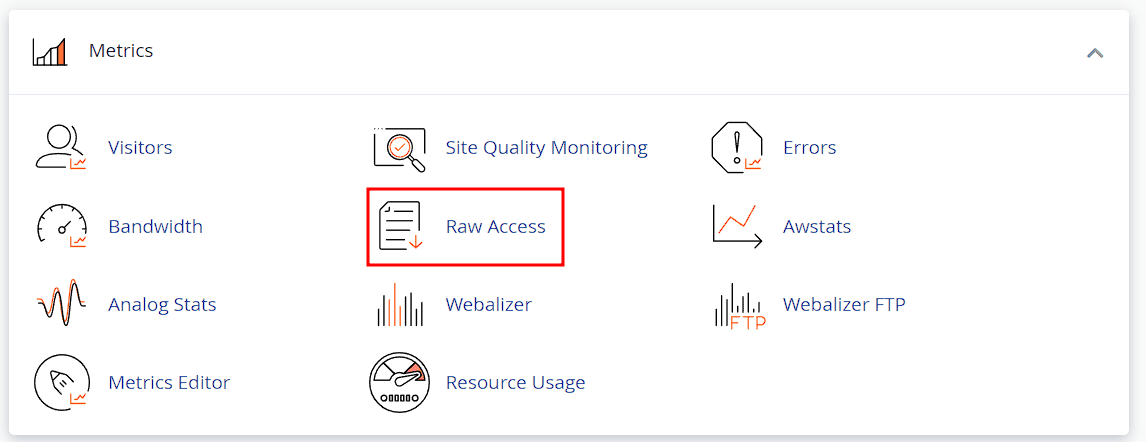
In cPanel, you can access various tools under the “Metrics” section:
- Raw Access: Allows access to access_logs.
- Awstats and Webalizer: Provide insights into site traffic.
- Errors: Provides access to error_logs.
- Resource usage: If an error caused resource limits to be exceeded, this tool provides snapshots, helping you locate the scripts and queries that were running at the time.
You can download the access logs from cPanel > Raw Access.
In the access logs, look for repeated requests that might indicate issues with a script or external bot.
You can also analyze status codes for errors:
- Requests with above-average response times may generate HTTP 500 or 503 status codes.
- Requests with a 404 error indicate broken links or resources that couldn’t be found.

From the error_log, you can identify:
- Script problems: PHP errors such as “memory exhausted”, “fatal error”, or “timeout” can indicate a code issue.
- Database problems: Slow queries and database connection issues can be identified by reviewing the error logs.
Solutions to resolve site slowness issues
Once you’ve identified the problems through performance analysis and logs, you can proceed with the following solutions:
- Code optimization: Review and optimize PHP, JavaScript, and CSS code to reduce loading time and enhance overall performance.
- Caching system: Implement server-side caching mechanisms (such as Varnish) and use caching plugins to reduce the load on the server.
- Database optimization: Optimize SQL queries, add missing indexes, and remove unnecessary or complex queries.
- Use of a Content Delivery Network (CDN): Distribute static content via a CDN to improve overall site load times.
- Upgrade: If the issue is due to limited server resources and persists after site optimization, consider upgrading to a higher-performance hosting plan with more CPU and RAM resources.
Before making any changes to the code, database, or trying a caching system, it’s advisable to create a test environment, such as using Softaculous.
By creating a staging site, you essentially replicate the live site in an isolated environment. This allows you to make changes without affecting the production site.
In the staging environment, you can disable plugins or modify the code to test if and how these changes impact performance.
Ready to build your WordPress site?
Try our service free for 14 days. No obligation, no credit card required.


