
GTmetrix is a tool that allows us to test the speed of websites. Among all the tools designed for this purpose, it is one of the best known and used today because it’s easy to use and the amount of metrics it allows us to examine.
In this guide, GTmetrix:the definitive guide, we will look at the different analysis options that GTmetrix offers. We will examine the reports and indications that the tool provides us to improve the performance of our site. Then we’ll delve into all the parameters taken into consideration by the tool and we’ll see how to make the most of all the functions, including the possibility of activating the monitoring of URLs and perform speed tests at a fixed rate.
In conclusion, we’ll see the different plans that GTmetrix offers us in addition to the free basic plan that already allows us to take advantage of almost all the functions with certain limitations.
Table of Contents

GTmetrix:the definitive guide : Analysis with GTmetrix speed test
To analyze the loading speed of a page with GTmetrix we just need to enter the URL that needs to be tested and click on the Analyze button. However, to get a more reliable result it is recommended to change the analysis options.
In specific, we can set the browser we want to use in the test and the connection type to see how these elements affect loading.

GTmetrix also gives us the ability to test by changing the location where the servers are located.
In this way we can set the location that is closest to the one where the server hosting our site is located and where most of the traffic to our site comes from. For example, if most of the traffic comes from Italy we’ll set London as the reference location.
By default Vancouver servers are used, but you can change and choose between:
- Vancouver, Canada
- Hong Kong, China
- Mumbai, India
- London, UK
- San Antonio, TX, USA
- Sydney, Australia
- Sao Paulo, Brazil.
With the free version you can choose from these 7 different locations, while with the Pro version you can use among 22 locations, you can see the list of all the servers on the GTmetrix website.
Remember that you can use the tool as a guest, but in order to take advantage of more features, including the ability to change server locations, you just need to register for a free account.
Among the options it is also possible to activate the Create Video function that we will examine specifically in the section dedicated to the Video tab of the Report.
Through the Advanced Options you can test on pages that require http authentication or login (by setting cookies). Also, for PRO versions you can set the screen resolution, use a specific user agent and use custom DNS settings.
What does our site performance depend on?
The speed test of GTmetrix allows us to focus on the performance of the site or rather of individual pages by analyzing the speed and the way in which pages are loaded and then focusing on the user side experience.
Having a fast site is essential to provide users with an optimal browsing experience and, above all, not induce them to abandon our site.
Site performance depends on several factors such as the use of HTTPS secure connection, page size, number of requests and hosting.
There are also other variables given by the complexity of the site, for example in a WordPress site loading times also depend on the plugins used, not so much by their quantity, but by their quality. You can learn more about the impact of plugins on performance by reading our article on the plugins that slow down WordPress.
In any case, a high-performance hosting is the starting point to have a fully functioning site.
Let’s take the case of our WordPress hosting. We ran a test on a new WordPress installation and recorded these results:

You can try out our service yourself with a free trial for 14 days, after which you can choose if you want to subscribe to a plan.
How GTmetrix report works
After running a speed test, at the top of the report page you will see a preview of the page you analyzed and the options you used. You can then check the location of the servers used for the test and the browser, as you see in this example.

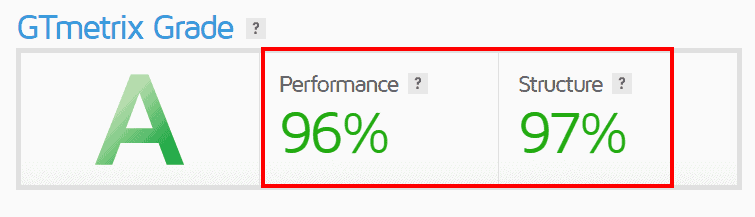
Immediately below you will see the GTmetrix grade which is the result of combining the Performance and Structure scores.

Specifically, the grade is obtained from the weighted average of these two scores:
the Performance score is worth 70%.
The Structure score accounts for 30%.
The GTmetrix grade was only recently introduced as of November 2020. Instead, two scores were previously shown which the tool collected under Performance Scores, namely PageSpeed Score based on Google’s tool and YSlow Score based on Yahoo’s tool.
Therefore, the score depended on how well the site met these two criteria. However, the recommendations considered by PageSpeed and YSlow focused only on the front-end of the analyzed pages.
In practice, the score gave an idea of how well a page was structured, but did not take into account how fast the page loaded for the visitor.
That’s why you could have top scores in PageSpeed and YSlow despite having pretty high page load times (Fully loaded time). Here is an example of a test that we highlighted in the guide on how to speedup WordPress.

The GTmetrix grade, on the other hand, is given by the combination of the score assigned to Performance and Structure. Let’s see how these two scores are calculated.
GTmetrix Performance Score
GTmetrix’s Performance score is nothing but the Performance score of Lighthouse, Google’s open source tool that evaluates Web page performance.
One major difference between Lighthouse analytics and the previous PageSpeed and YSlow metrics is that Lighthouse puts the user experience first. To understand exactly how it does this, let’s look at what metrics the scoring is based on.
To calculate the Performance score, six metrics are examined and each is given a different weight.
In this section we will only see what metrics are considered and how much they affect the score. We will then look at the different criteria one by one when we look at the Performance tab.
Loading performance (affects 55% of the total score) and is in turn influenced by:
- First Contentful Paint (15%)
- Speed Index (15%)
- Largest Contentful Paint (25%).
Interactivity (accounts for 40% of the total) and is in turn dependent on:
- Interactive Time (15%)
- Total Blocking Time (25%)
Visual stability (affects 5%) and is in turn determined by the
- Cumulative Layout Shift (5%).
GTmetrix Structure Score
Structure Score is a proprietary GTmetrix metric that is always based on Lighthouse criteria. The score indicates whether the analyzed page meets the criteria for optimal performance.
GTmetrix:the definitive guide – Web Vitals
The GTmetrix report in addition to showing us the GTmetrix Grade given by the performance and structure scores we just reviewed also allows us to view the scores of our page based on the Web Vitals metrics.

Web Vitals or Core Web Vitals are metrics introduced by Google in 2020 to evaluate the user experience on a website.
Specifically, GTmetrix shows us three metrics: Largest Contentful Paint, Total Blocking Time, and Cumulative Layout Shift. We’ll see specifically what they represent when we talk about the Performance tab.
Summary Card
The Summary tab provides us with important information to improve the performance of the analyzed page. In this tab, in fact, GTmetrix highlights some main aspects of the analysis.
In the Summary tab we find:
Speed visualization: it is a visual indicator that shows us the loading phases of the page, showing us which sections of the page are loaded at a given time. It gives us an idea, therefore, of how our page appears to visitors while it is being loaded completely.

Top Issues: in this section there is a summary of the issues that have a major impact on page performance. Improving the issues highlighted in this section and retesting the page will see the items in this section change.

As we will see later, the list of all problems and suggestions on how to improve them can be viewed in the details of the Structure tab. In any case it is possible to view the details of the main problems by clicking on each one from this section.
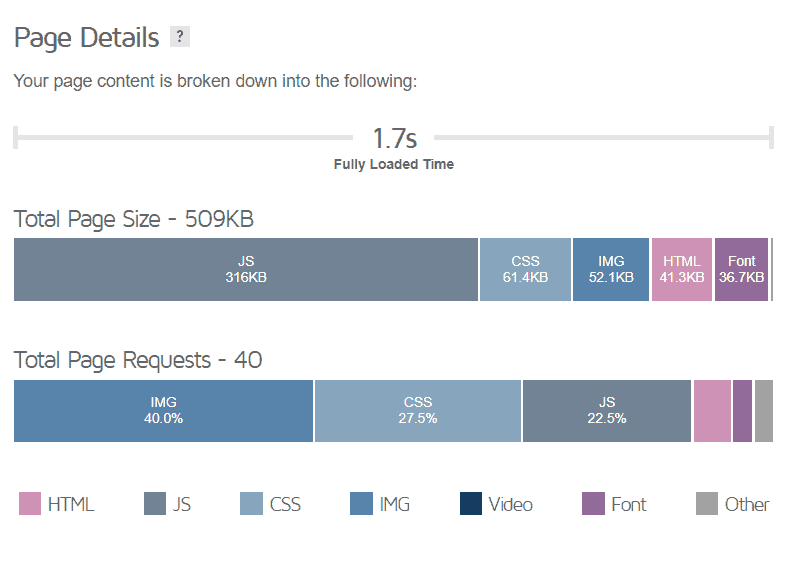
Page details: in this section we are shown a chart that highlights the types and number of requests per page and the size of the elements.
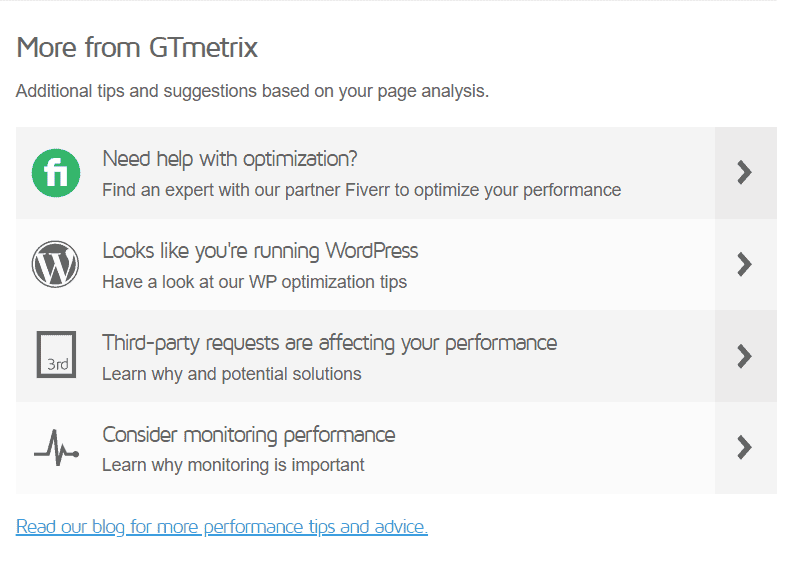
More from GTmetrix: the section contains GTmetrix resources and refers to different guides according to the problems highlighted by the analysis.
Performance Card
In the Performance tab of GTmetrix we can examine in detail the metrics that go into influencing the Performance score.
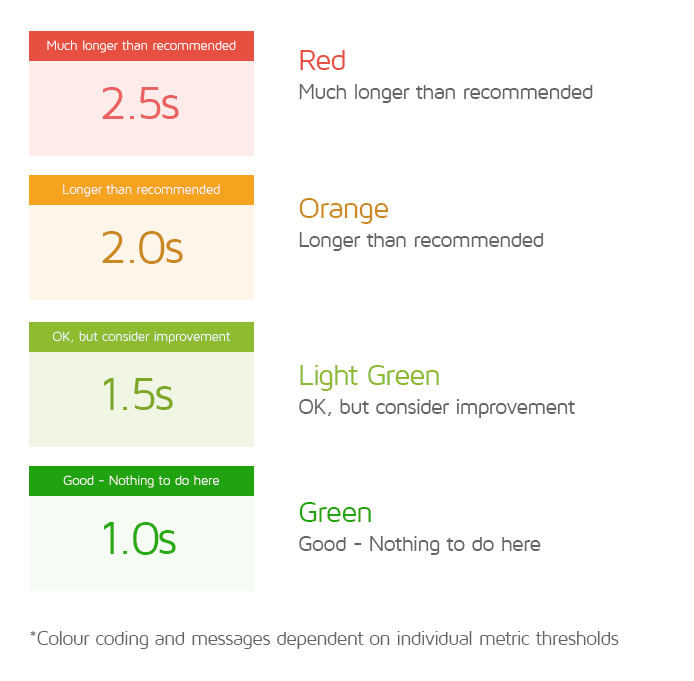
Next to each one you will find the result recorded by the analyzed page and an indicator that gives us an idea of what can be improved or confirms that the scores for that metric are in line for optimal results.
Right below the metrics that go into determining the Performance score are the Browser Timing statistics. These are metrics that were previously considered more important, but now do not affect GTmetrix’s Performance score.
Let’s first see what the six metrics are that go into determining the Performance score and then focus on the statistics that GTmetrix collects in the Browser Timing section.
Performance Metrics
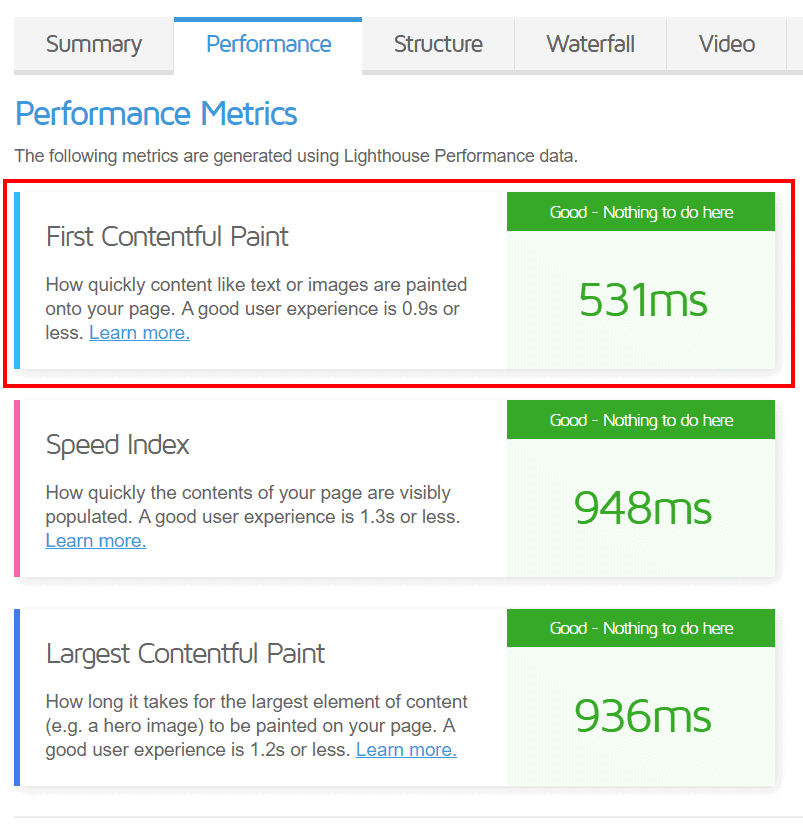
First Contentful Paint
First Contentful Paint (FCP) indicates how quickly site visitors can see the first elements of the page such as text or images. The metric therefore refers to the speed at which the page loads, and the ideal score is 0.9 seconds or less.
Specifically, the thresholds are as follows:
- FCP less than 934 milliseconds: good (good, there’s nothing to do here)
- FCP between 934 and 1205 milliseconds: can be improved (OK, but consider improving it)
- FCP between 1205 and 1600 milliseconds: higher than the recommended value
- FCP greater than 1600 milliseconds: much higher than the recommended value.
You can find this metric in the Performance tab as you see in this screenshot.
On the Waterfall tab you simply hover your mouse over the loading time of the first request to see the First Contentful Paint as seen here.

To improve the FCP you can take some steps such as avoiding multiple redirects, using a CDN and reducing the initial server response.
Speed Index
The Speed Index (SI) measures how fast the visible parts of the page load. It is also a metric related to page load times and its ideal value is 1.3 seconds or less.
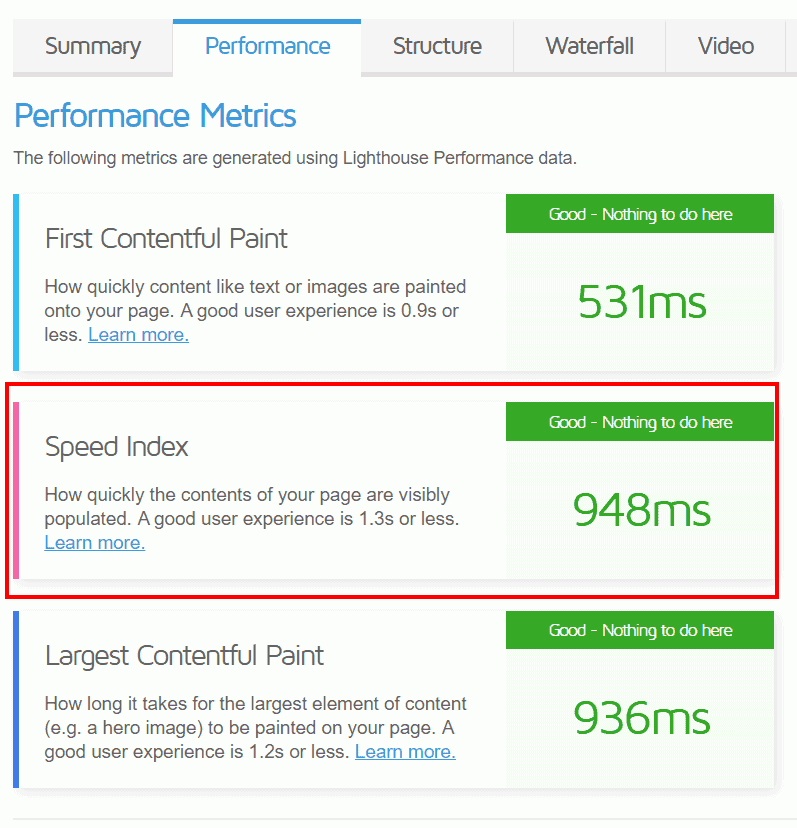
Specifically, here are all the Speed Index thresholds:
- SI of 1311 milliseconds or less: good
- SI between 1311 and 1711 milliseconds: can be improved
- SI between 1711 and 2300 milliseconds: higher than recommended value
- SI greater than 2300 milliseconds: much higher than the recommended value.
To improve the Speed Index you should try to optimize the page in order to have a better FCP and LCP score. You can also improve performance with these methods: remove unused JavaScript, reduce third party code and JavaScript execution time.
Largest Contentful Paint
The Largest Contentful Paint (LCP) score is given by the time it takes to load the largest content item visible on the page. The element in question can be an image or a block of text depending on the page being analyzed.
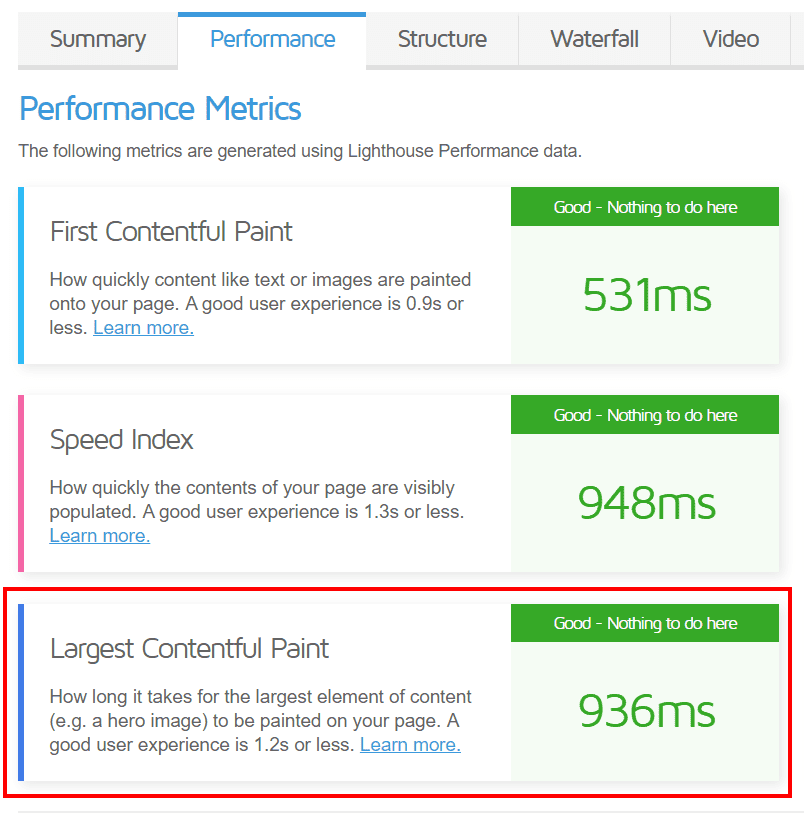
Keep in mind that LCP is part of the Google Web Vitals. This means that Google considers it one of the key parameters that influences the user experience.
The ideal score should stay below 1.2 seconds, and here are all the thresholds identified by GTmetrix:
- LCP of 1200 milliseconds or less: good
- LCP between 1200 and 1666 milliseconds: can be improved
- LCP between 1666 and 2400 milliseconds: higher than recommended value
- LCP greater than 2400 milliseconds: much higher than the recommended value.
To improve LCP you can try to reduce server response times, for example by using a CDN. You should also optimize images (e.g. by using recommended formats such as webp).
Time to Interactive
Time to Interactive (TTI) represents the time it takes for a user to interact with the page. Therefore, it is not enough that an element of the site becomes visible, but it must also respond to user interactions. The ideal value for Time to Interactive is under 2.5 seconds.
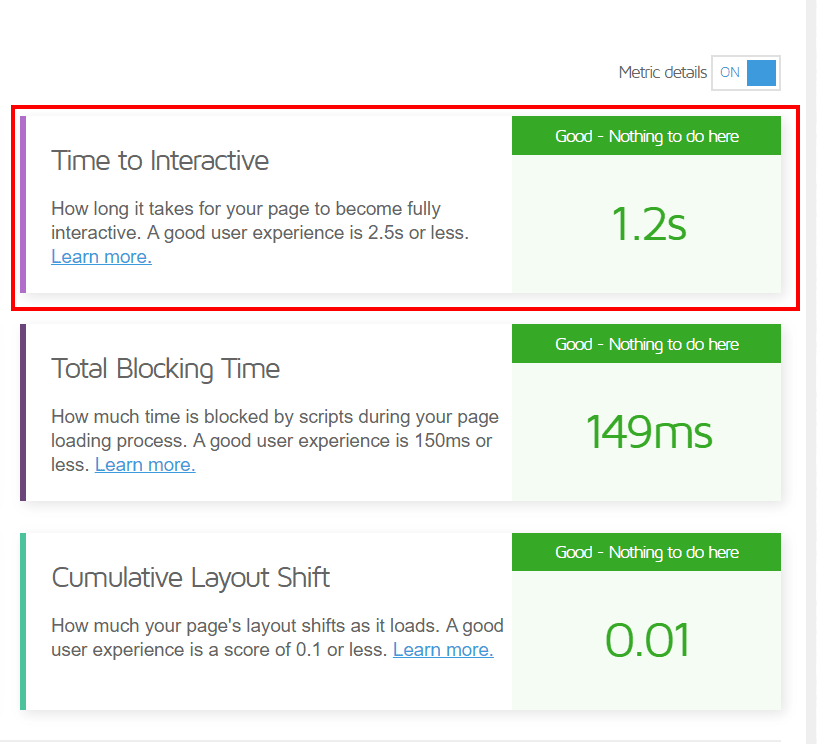
In detail, the thresholds used by GTmetrix for TTI are these:
- TTI equal to or less than 2468 milliseconds: good
- TTI between 2468 and 3280 milliseconds: can be improved
- TTI between 3280 and 4500 milliseconds: higher than recommended value
- TTI greater than 4500 milliseconds: much higher than the recommended value.
Among the avenues you can take to improve your TTI, you can focus on JavaScript execution, for example by reducing the script execution time. Keep in mind that critical chain requests can also have a significant impact on page loading.
Total Blocking Time
The Total Blocking Time (TBT): measures the time between the First Contentful Paint and the Time to interactive. It represents, therefore, the time during which the page turns out to be still blocked or does not answer to the interactions of the customers.
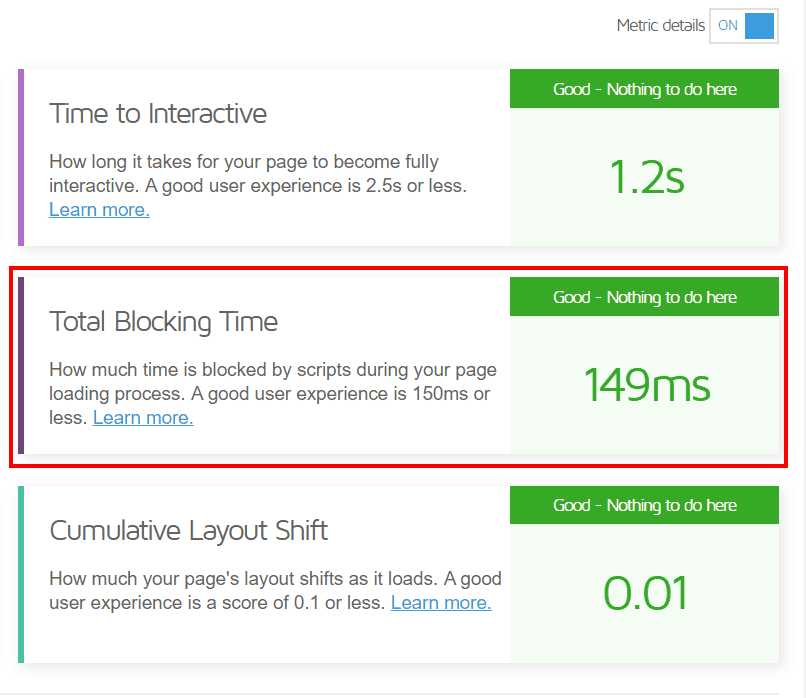
We talk about total blocking time because this time includes the sum of the individual times needed for each request (individual blocking time). Why mention it when there was already Time to Interactive?
Unlike TTI, which represents exactly how long it takes the page to become interactive, analyzing TBT allows you to understand which processes take the longest.
The biggest impact on performance may be due to third-party code or JavaScript execution time. Knowing which of these processes carries the most weight allows you to improve TBT and consequently improve the user experience.
An ideal TBT should be below 150 milliseconds. These are the thresholds used by GTmetrix:
- TBT of 150 milliseconds or less: good
- TBT between 150 and 224 milliseconds: can be improved
- TBT between 224 and 350 milliseconds: higher than recommended value
- TBT greater than 350 milliseconds: much higher than the recommended value.
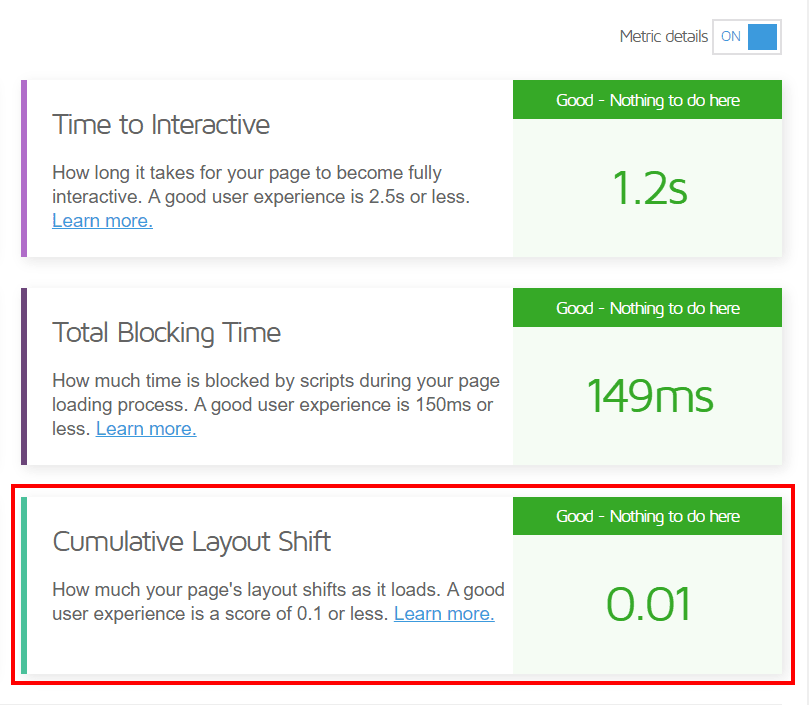
Cumulative Layout Shift
Cumulative Layout Shift (CLS) measures page stability by analyzing the layout shift that occurs as the page becomes visible.
The measurement takes into account both the area affected by the displacement and the overall displacement of the elements, i.e. how far an element moves from its starting position.
A high value is detrimental to the user experience on the site, especially for those who visit the site from mobile devices. With more and more users browsing the web from mobile devices, it won’t surprise you to learn that CLS is part of Google’s Web Vitals.
The ideal value for CLS is a score below 0,1. Here are the thresholds set by GTmetrix for this metric:
- CLS equal to or less than 0.1: good
- CLS between 0.1 and 0.15: can be improved
- CLS between 0.15 and 0.25: higher than recommended value
- CLS greater than 0.25: much higher than the recommended value.
To improve CLS, you can specify image sizes in the page code and reserve static spaces for ad spaces. Other elements to consider are dynamic banners and elements embedded in the page such as tweets or Instagram posts.
Browser Timings
In this section we find other metrics that may be useful, but do not contribute to the Performance score.

Redirect duration
The duration of the redirects is the time required by the various redirects to reach the destination address. If there are multiple redirects the single duration is added up and the total time is shown in this section.
Generally depends on redirect 301 which may have been implemented for:
- a redirection of a non-www page to a www page (or vice versa)
- a redirect from http a https
- a redirection from the desktop to the mobile version of the site.
Connection duration
The connection duration is the time it takes to connect to the server and request the page. As well as while all redirects are completed even during this loading period the browser screen will still be blank.
Backend duration
After the connection has been established and the request has been forwarded to the server, the server must send a response. The time it takes for this action to complete is referred to as the backend duration.
Time to First Byte
The Time to First Byte equals the total time from the beginning of the request to the moment in which the first byte is received in response. This means that its duration equals the sum of the three values that we have just seen: duration of the redirects, duration of the connection and duration of the backend.
First Paint
The First Paint measures the time it takes for the page to start rendering. It can then correspond to the appearance of the background color or some element of the graphics. This metric should not be confused with the First Contentful Paint that we mentioned earlier. The FCP, in fact, is the time it takes for a content element to be displayed on the screen (such as text, an image, or a header).
DOM Interactive Time
In order for the browser to interpret and render an HTML document, it must generate a DOM tree, which is an internal structure. The time it takes to create it is referred to as DOM Interactive Time.
DOM Content Loaded Time
It corresponds to the time it takes for the DOM to be ready, i.e. it is fully loaded and there are no stylesheets that have yet to be loaded and block the execution of JavaScript.
Onload Time
The Onload Time marks the point at which the page has been processed and resources have been downloaded.
Fully Loaded Time
To measure it, GTmetrix waits until the page stops transferring data, i.e. the network has been idle for 2 seconds. Other tools, such as Pingdom, report only onload time as a metric.
Structure tab
Recommendations on how to fix the issues highlighted on the page are collected under the Structure tab.

In this tab we find the evaluations sorted in terms of impact: high, medium-high, medium up to and including audits that are reported for informational purposes only. Of course, improving results marked as high will have a greater impact on performance than those with lower impact.
The sum of all ratings goes into the overall Structure Score you see at the top after each analysis.
The Structure tab then is useful to take note of the problems on the page and also helps you solve them. By clicking on a single problem in the list, in fact, you can get more details and understand how to improve every single aspect.

Waterfall board
The Waterfall tab of GTmetrix shows us a waterfall graph with all the requests that are loaded on the page and also shows us the order in which they are loaded. Let’s see how to interpret the graph.
How the Waterfall chart is organized
The chart presents us with a list of resources and a set of details. Clicking on each resource takes us to additional tabs that change based on the type of request and show us details such as the type of HTTP request used (GET or POST) and so on.
The gray bar at the bottom of the chart shows us the total number of requests on the page, the overall size, the Fully Loaded Time and the Onload time.

For each resource we are shown the following elements:
URL
In this column we are shown the URL of the resource, in this way we know which is the resource in question. To visualize the complete URL we just need to move the mouse over it. If we want to open the resource in a new browser tab, we just need to click on the address while holding down CTRL.
Status
This is the HTTP status code returned by the server for that request. The status will be 200 when the request has been transmitted successfully. Another example of a status is 301 in case the resource URL has been moved permanently. Pay attention to status codes that represent client errors, 4xx errors like the error 404 and 5xx server errors like the error 500.
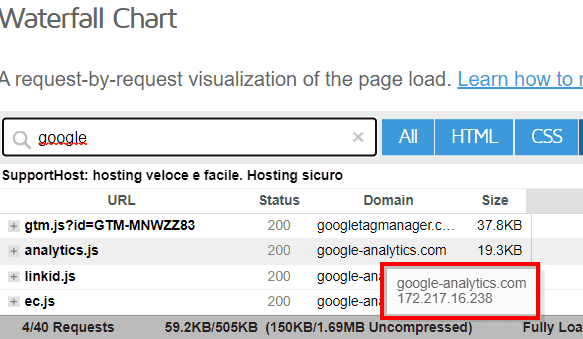
Domain
This column tells us the domain of each request, so we can more easily identify which resources are being loaded from third-party servers. In this example you can see that fonts are imported from Google.

By hovering the mouse over individual domains we can see the IP address.
We can also display the IP addresses in a separate column. To do so, click on the arrow as shown in this screenshot and check the Server IP entry.

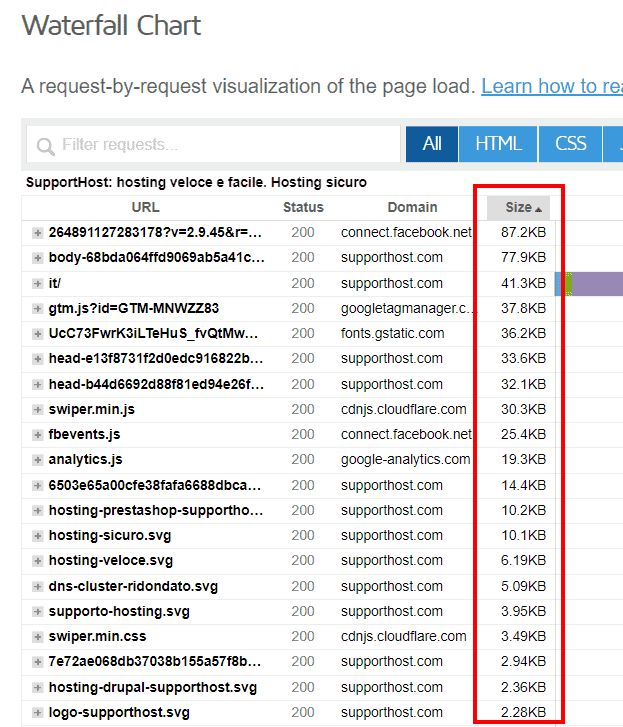
Size
In this section we are shown the size of each resource. We can know the compressed and uncompressed dimensions by hovering with the mouse over the individual values.

Note that in the column you will see the compressed size, if you want to add the column with the uncompressed size as well click on the arrow as shown below and check Uncompressed size.

Timeline
It shows us details about the loading time of each resource and tells us the total loading time in milliseconds or seconds.
By hovering the mouse over the colored bars in the timeline, we can see in detail the durations of the individual metrics (FCP, LCP, TTI, and so on).

These metrics are also shown as colored vertical lines on the timeline chart.
When you place the mouse on an element of the timeline you can also see a legend that explains what the different colors represent, let’s see them briefly.
Brown – Blocking: equals the time it takes for the request to be initiated. For example, it can depend on the time it takes to execute JavaScript.

Blue – DNS Lookup: represents the time it takes for DNS resolution to complete, i.e. the time it takes to retrieve the IP address associated with a given domain name.

Green – Connecting: equals the time it takes to establish a TCP connection. Often, the time required for the SSL connection is also included in this metric.

Red – Sending: is the time taken by the browser to send the request to the server.

Purple – Waiting: this is the time it takes the server to generate a response.

Gray – Receiving: equals the time it takes for the browser to download the response from the server. It may increase if the request is for large files.

Additional Columns
As we have seen you can also add additional columns to our chart:
- Type: indicates the type of request (image, font, CSS, JS, etc.)
- IP Server: show IP address of the server of each request
- Connection: indicates the ID of the TCP connection used
- Uncompressed size: shows us the uncompressed size of individual requests.
By clicking Reset you can return to displaying only the default columns in the chart.

Change sorting and filter the Waterfall chart
By default, GTmetrix’s Waterfall chart is sorted to show resources in order of loading.
To make it easier to find the resources we are interested in, we can change the order of all the columns upwards or downwards. Let’s take a practical example with the Size column.
If we want to sort the resources by size we just need to click on the Size column.
With a click on the Size column we order the resources in ascending order according to size, from smallest to largest.
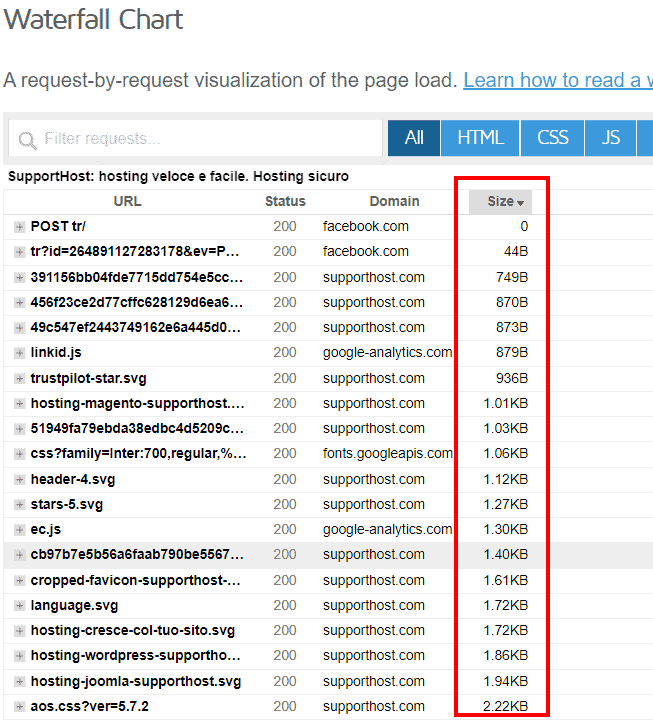
A second click on the Size column allows us to have the reverse order, from largest to smallest.
We can also filter the resources shown in the chart. We can filter by request type font, image, CSS, HTML and so on by clicking on the blue buttons at the top as you see in this screenshot.

If we select more than one type of resources, for example fonts and images, we will be shown all the resources that correspond to one of the two types.
It is also possible to filter the resources by keywords. To do this we just have to type the words that interest us in the search bar, as in this example.

We can use the search bar to filter resources by properties, such as status code or size.

To filter the results in this way you have to use the syntax used in Firefox developer tools. You can check this table for examples.
Video Card
From the Video tab of GTmetrix you can repeat the page speed test by enabling the video option. This will record a video showing the page as it loads and show you the exact moment when there is slowdown.
Remember that you can also enable the video option from the GTmetrix home page before running a test. Just click on Analysis Options and set the Create Video option to On.

After running a speed test on GTmetrix by enabling the video option, we can click on the video card to see the results.
In the bar, you’ll see the main metrics highlighted: Time to First Byte, First Contentful Paint, Largest Contentful Paint, Time to Interactive, Onload and Fully loaded and on screen a legend that indicates the colors associated with them.
At the bottom you will see three buttons as shown below:

1 – activate full screen mode
2 – activate or deactivate the legend
3 – change the speed of video playback.
Schedule History
If you run more than one test of the same page, GTmetrix will generate a graph in the History tab to show you how the results compare.
Keep in mind that the graph will be generated even if you are using GTmetrix as a guest, but in this case it will be deleted after one month and will show at most 10 GTmetrix reports.
By creating a free account on GTmetrix you can view up to 200 reports in the History graph. You can also schedule page monitoring and collect performance data over time.
With GTmetrix Pro account 1000 reports are shown by default, but you can view more by choosing the date range.
In the History tab you’ll find three charts: page metrics, page sizes and request counts, and page scores.
Page Metrics Chart
This chart from GTmetrix compares us different reports based on key metrics: Time to First Byte, First Contentful Paint, Largest Contentful Paint, Onload Time and so on.

Chart Page sizes and request counts
The graph compares the size of the page and the number of requests. It allows us to see at a glance the changes in the different tests.

Page scores chart
The chart compares the scores of the different reports showing us the GTmetrix grade, the Performance score and the Page Structure score.

Interacting with History charts
By default all 9 metrics are shown for the page metrics chart, but we can choose to display only some of them by deselecting the others. With a click on the individual metrics at the bottom we can disable or enable them as seen here.

The metrics we have chosen to show will have the text in black, while those that are disabled will be in gray.
The settings we choose will also be maintained for subsequent visits, this means that if we show as in our example only FCP, LCP and CLS, the next time we open the History tab we will see the same graph with these three metrics.
By selecting a point on the chart we have several options as you see in this screenshot:

View Report allows us to access the report for that date.
Compare to allows us to compare that report to another in the chart, showing us a result like the one you see below in our case:

Delete allows us to delete that report and no longer show it in the chart.
We can narrow the chart down to a certain period (a day, a week, 1 month and so on) by clicking on the period next to Zoom. Or choose to only show results from a certain time period by setting the reference dates in the History data range section as I show you in this example.

It is also possible to view a specific portion of the graph in detail, we just drag the mouse over the section we are interested in to highlight it, as you see in this screenshot.

We can add notes to the chart, click on Add notes and then click on the point in the chart where we want to insert the comment. Then we type the comment and click on the Save button.

GTmetrix also allows us to download the history report in csv format, to do so we just click on the Download History button as you see in this screenshot.

Set up monitoring and alerts
Remember that you must have created an account in order to enable page monitoring and set alerts. With the free version you can use monitoring by only using Vancouver as a test location and you can monitor a single URL on a daily, weekly or monthly basis.
Monitor a page with GTmetrix
From the dashboard we scan a new URL or open one of the reports we have already created and then click the Monitor button from the right sidebar as you see in this screenshot.

At this point we can choose the frequency with which the page should be analyzed among the options: daily, weekly and monthly. Monitoring on an hourly basis, on the other hand, is only available with PRO (Starter) plans.
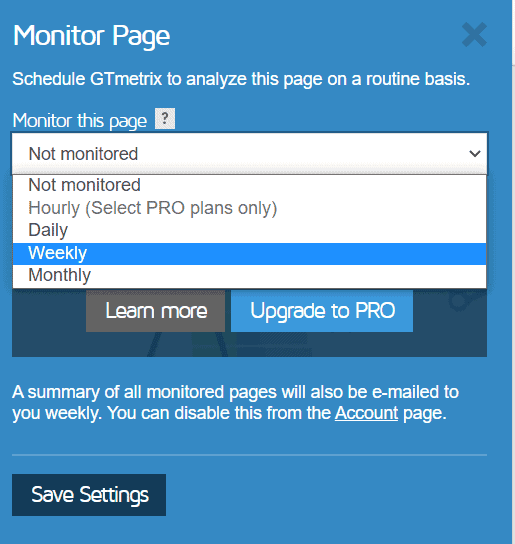
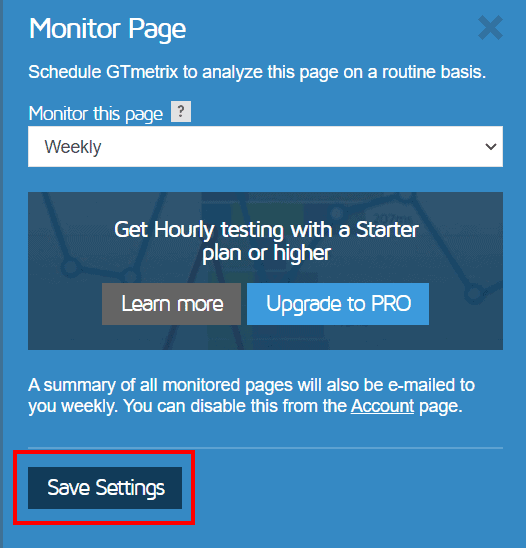
Choose the frequency and click the Save Settings button to confirm.
Disable monitoring
From the GTmetrix dashboard you can check which URLs you are monitoring by clicking on the Monitored tab.

The two symbols next to the location of the servers, which you see highlighted in this screen, indicate that we have set up monitoring and alerts.
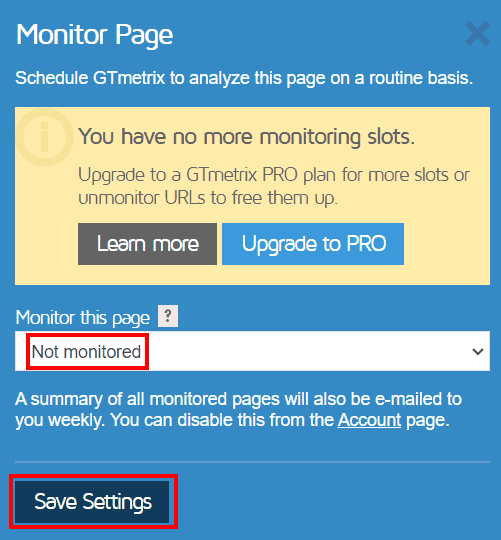
To deactivate monitoring of a page we just need to open the report and click on Monitor. Then choose the Not monitored option from the drop-down menu and click on the Save Settings button.
Set alerts with GTmetrix
After opening a report we click on the Set Up Alerts button from the sidebar.

Make sure that the Enable E-mail Alerts option is set to On to receive an email whenever the speed test result of a page you are monitoring has exceeded a defined threshold.
You can set the conditions for which you wish to be notified.
Click on Add a condition.
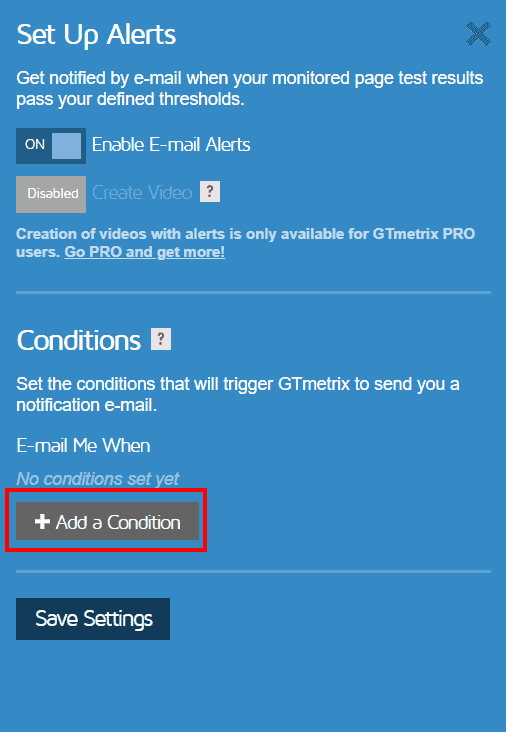
From the first drop-down menu select the parameter you want to keep under control, such as GTmetrix grade, Performance score, Fully loaded time and so on.
The second menu allows you to set the condition (less than, greater than or equal to). The third parameter can be represented by another drop-down menu, as in the case of GTmetrix grade where you can choose a value from A to F.
If, on the other hand, it is a numeric parameter you will find a box in which to enter the reference value, as in this example.
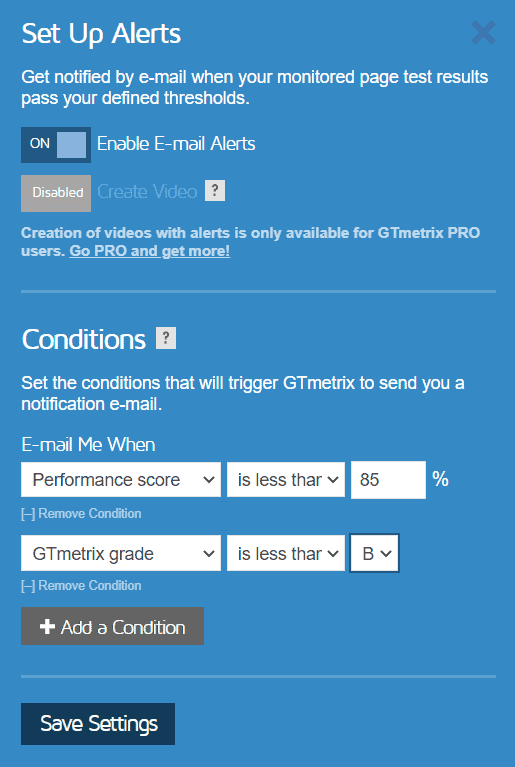
You can also set up more (up to a maximum of 10), in this case when one of the conditions set occurs you will receive an email.
In our case, therefore, we will be alerted when the Performance score falls below 85% or if the GTmetrix grade is below B.
After setting the conditions click on Save Settings to confirm.
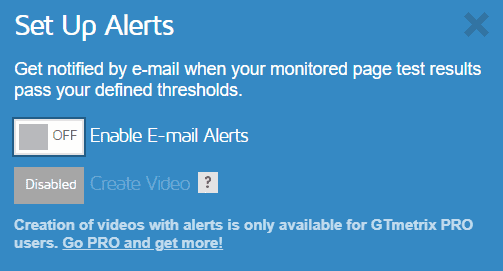
Disable alerts
To disable the alerts we open the report, click on Set Up Alerts and click on the button next to Enable E-mail Alerts so that it is set to Off.
Errors during analysis with GTmetrix
In some cases speed testing a page with GTmetrix may generate errors. The most common case is an error HTTP status code.
For example, if the address you entered was not typed correctly you may encounter a 404 error as in this example.

In other cases there may be a problem with the HTTPS protocol or with the configuration of the SSL certificate. GTmetrix, in fact, analyzes only sites with a valid SSL certificate.

Also, if the page loading is too slow and exceeds the two-minute limit for performing the speed test, GTmetrix will fail to complete the page analysis.
GTmetrix: plans and prices
With GTmetrix you can choose between several individual plans available: basic, solo, starter and growth. All the features we’ve talked about in this guide are available for free with the basic plan. As we’ll see, PRO plans allow you to have benefits such as more slots to monitor URLs.

GTmetrix: Basic plan
The basic plan is free and has no expiration date, it allows you to monitor a maximum of one URL on a daily, weekly or monthly basis. This plan grants us up to 50 tests per week, 10 credits per day to use GTmetrix API and keeps data in reports for 3 months.
As we saw before with the basic plan, which you can get by simply registering an account instead of using the site as a guest, you can change the location of the servers from which you run your tests. There are 7 locations available with the free version, which would increase by activating the paid plans.
GTmetrix: Solo plan
The Solo plan can be activated for $12 per month or $10 per month if you activate for a full year. With this subscription, URL monitoring slots increase to 3 and API credits to 25. You can run a maximum of 150 tests per week and the data in the reports is stored for six months. You also get access to 15 additional locations to speed test and can analyze pages on mobile devices.
GTmetrix: Starter plan
For $24 per month or $20 if you activate the annual subscription, you can activate the GTmetrix Starter plan. The number of URL monitoring slots increases to 6 and they can be monitored hourly as well. You can also perform up to 175 tests per week and have 50 API credits per day. The data is again kept for six months and the benefits you get with the Solo plan apply when it comes to choosing between test servers and mobile devices.
GTmetrix: Growth plan
The Growth plan is available for $47 per month or $40 per month if you activate annual billing. This type of plan allows you to monitor up to 12 URLs every hour, you have 100 API credits per day, and you have 250 speed tests per week.
You can also request PDF reports with your company’s logo and description for an additional fee of $510 per year.
Conclusion
In this article, GTmetrix:the definitive guide, we have seen how GTmetrix can be a valuable in improving the performance of our site. Understanding how to interpret the results of GTmetrix speed test reports allows us to highlight the main problems of the site and identify which resources are increasing loading times.
To get reliable results during testing, remember to set the server location and do more speed tests to compare the results and to compare loading times with different connection speeds and different devices (with the PRO version). Don’t limit yourself to testing only the home page of the site, but also analyze the other important pages.
Were you able to improve your site’s performance by following the suggestions with GTmetrix? What tools do you use to check your site’s performance? Let me know in the comments below.
Ready to build your WordPress site?
Try our service free for 14 days. No obligation, no credit card required.


