
Pingdom Website Speed Test is among the most popular tools for analyzing the speed of a website. Like GTmetrix, Pingdom provides a free tool and paid subscription plans.
In this article, Pingdom:the definitive guide, we will see how site speed analysis works with Pingdom’s free Website Speed Test. We will see how to analyze the report to extract useful information and thereby be able to improve the performance of our website.
Table of Contents
Analysis with Pingdom speed test
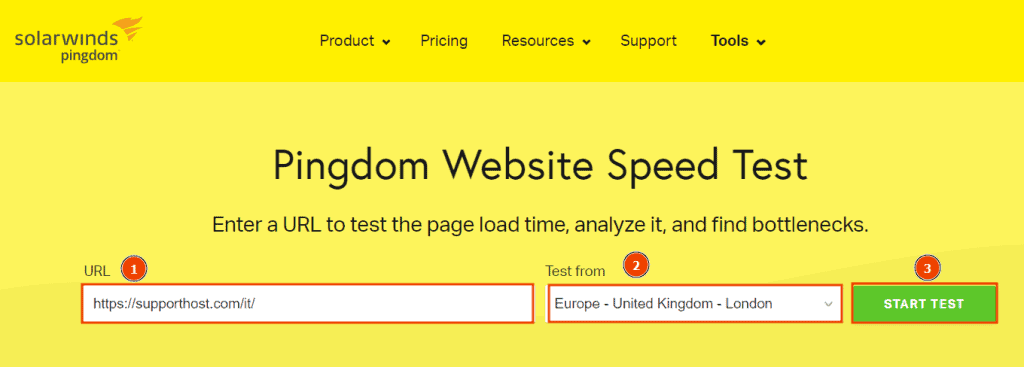
Testing the speed of a website with Pingdom is actually really simple. All we need to do is log on to the free speed measurement tool’s site, enter the URL of the site to be tested, choose the location from which we will perform the measurement, and start the test.
With Pingdom, testing the speed of a site thus requires only three steps:
- enter the URL of the site
- choose the location from which to run the test
- click Start Test to start the measurement.
What locations can we choose with Pingdom?
The location from which to run the site speed test affects the result and it is important, therefore, to choose it wisely.
To get reliable results you should choose the location closest to where the traffic to your site is coming from as the reference location from which to run the tests. For example, if your site’s audience is in Italy you can run the test from Frankfurt or London.
Currently on Pingdom we can choose from the following locations for our speed test:
- Tokyo, Japan (Asia)
- Frankfurt, Germany (Europe)
- London, UK (Europe)
- Washington, USA (North America)
- San Francisco, USA (North America)
- Sydney, Australia (Pacific)
- São Paulo, Brazil (South America).
How does Pingdom’s speed test work?
Like other speed testing tools, Pingdom tools allows us to get several results: a numerical score on site performance, information about the number of requests, page size, and page load time.
Loading time is certainly one of the most important factors in a speed test, but we should know that actually when we talk about loading time (Load time) we have to make some distinctions.
Two separate metrics are, in fact, taken into account depending on the tool we are using to analyze our site.
On one side we have onload time and on the other side we have fully loaded time. To get an accurate idea of the site’s performance we must, therefore, know which of the two metrics the testing tool we have chosen is using.
Some tools such as GTmetrix and WebPageTest allow us to see the results of both metrics. Pingdom tools, on the other hand, uses only onload time.
Onload time is the time it takes for the page to complete processing and download all resources (such as images).
The Fully Loaded time is the time when the page stops loading other content, so it is subsequent to the onload time and at least two seconds must have passed since the network is idle.
So as you can see, these are two slightly different metrics and it is important to know this difference to understand why we have different results using different tools.
What affects site performance?
If you care about site speed, you can check out our in-depth guide how to speed up WordPress.
Speed tests like Pingdom help us find out how fast our site is, giving us important information on how to improve performance.
But why are there so many tools to help us keep track of our site’s speed? Having a fast site is important to improve the user experience and ensure that users do not abandon the site.
Ideally, the site loading time should be less than 2 seconds. But what does site speed depend on?
Site performance starts right from the hosting, so the first thing to do is to start with a performing hosting.
Let’s take an example with our shared hosting. We ran a test on a new WordPress installation with these results.

At SupportHost in order to always provide maximum performance we limit the number of accounts on each server. Also on WordPress hosting we use LiteSpeed and LSCache.
Want to check it out for yourself? Try our service for 14 days with a free trial and only after that decide whether to subscribe for a plan.
Loading times of course also depend on the site itself, so you should make sure to use HTTPS protocol and reduce the page size and number of requests.
A loading time analysis system is essential at these stages, and this is where website speed analysis tools such as Pingdom come in.
How Pingdom’s report works
When you run a speed test on your site with Pingdom, the tool generates a report with performance results.
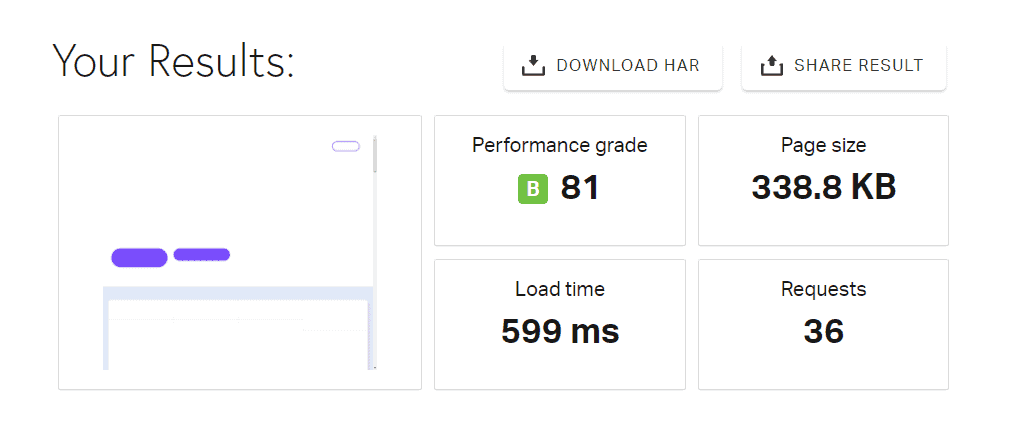
In the top mirror, we have a summary of our results. We are shown a score, performance grade, page size, number of requests, and load time.
What does Pingdom’s summary show us?
In the Pingdom tools summary, we can see the most important metrics highlighted by our speed test.
Specifically, we have:
Performance grade: a score from 0 to 100 accompanied by a letter grade (A, B, C, etc.). This score is influenced by several factors that we can explore in detail by looking at the Improve page performance section.
Page size: it shows you the size of the page overall, as we will see in the Content size by content type section, we can check which resources burden the page size the most and consequently we can optimize them.
Load time: allows you to see the total loading time of the site (i.e. onload time).
Requests: shows you the total number of requests for that page. A large number of requests results in longer load times.
Remember that the thing you should focus on is load time, not score. Improving the load time will consequently improve the score.
In-depth analysis with Pingdom
Subsequent to the summary, Pingdom allows us to go deep with the analysis of our site by showing us several sections.
Improve page performance: here we find suggestions on how to improve the performance of the analyzed page. Similar to the Top Issues section of GTmetrix.
Response codes: shows us the HTTP response codes, allowing us to quickly identify the presence of 4XX or 5XX errors.
Content size and requests: these are the sections where we can analyze in detail the size of the elements in the page and the type of requests.
File requests: this section shows us a waterfall analysis of the requests on the page (waterfall).
The Improve page performance section of Pingdom.
Pingdom, in addition to providing us with an overall score on our site’s performance directly in the summary, also helps us understand what the problems are with the site and how we can improve its performance.
To do this, the tool provides us with an Improve page performance section after each speed test.
In this section we are given suggestions to follow to improve the score and thus the performance in general.
For each suggestion, Pingdom also shows us a grade. The suggestions in orange and red are the ones to focus on, while those with a high score and a green grade are the aspects that are already doing well as they are on the site.

Here are some of the suggestions you can find in this section:
- use gzip compression
- add expires headers
- reduce the number of HTTP requests
- reduce DNS lookups
To get more details on the individual suggestions just click on the arrow next to each one to read a brief description.
The Response codes section of Pingdom
In this section the tool for testing the speed of our website shows us the HTTP response codes of the parsed page.

Let’s see what codes may appear:
200 or 2xx: this is the code to indicate a successful request, the server responded as expected.
3xx: 3xx codes represent redirects, for example a 301 redirect redirect is a permanent redirect, while a 302 is a temporary redirect.
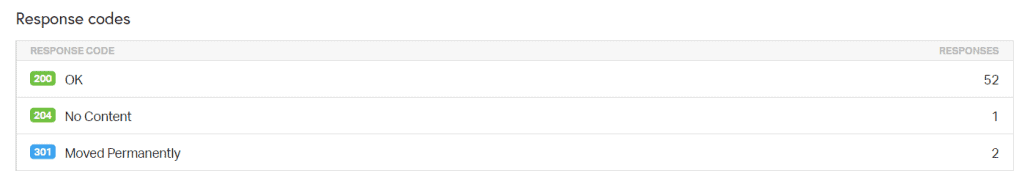
4xx: these are the client-side error codes, for example, error 404 indicates a not found resource, while error 403 indicates an inaccessible resource.
5xx: these codes represent server-side errors, these are internal server problems or errors in processing requests. Examples include error 500, 502 bad gateway or 504 gateway time-out.
If 4xx or 5xx errors are present among the response codes, you can check in the waterfall graph which resources the error belongs to and correct it.
Pingdom’s content size and requests sections.
To help you understand which types of site content use the most resources or have the largest size, Pingdom gives us four sections that collect content and requests by type.
Content size by content type
Here we are shown the list of content by type (images, fonts, CSS, HTML, and scripts) and are shown size and percentage of the total.
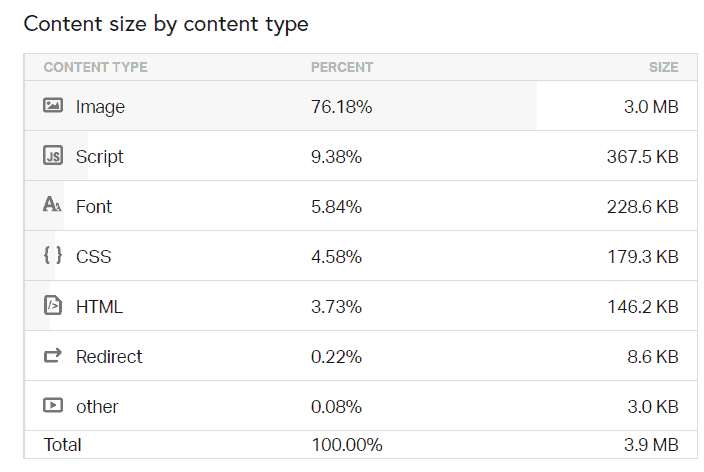
In most cases the highest percentage is precisely images, which weigh approximately 50% of the total size and total requests of a web page.
Fortunately, in order to reduce the size of a page, a great place to start is just to reduce the size of images. Check out the article on how to optimize images on WordPress on WordPress to see how to do it in practice.
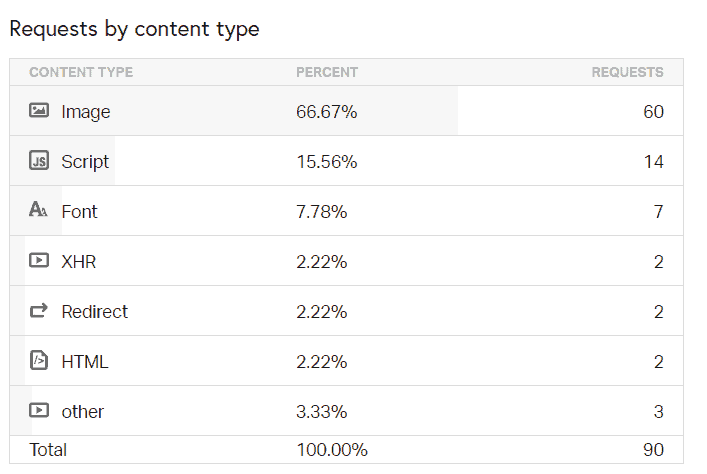
Request by content type
This table shows us the requests on the page we parsed.
Content size by domain and Request by domain.
This section allows us to identify the source of the content that most burdens the page size.

This makes it easy to figure out how much external content or resources are being loaded onto our site. Remember that it is good to limit the number of external requests to improve site load times.
The File Requests (Waterfall) section of Pingdom.
Pingdom also allows us to analyze all requests in detail thanks to the waterfall analysis we find in the File requests section.
In Pingdom’s waterfall graph we can find a bar with the loading times for each request. For each request, we are also given the type of content, the corresponding URL, and the size.
The individual requests can be extended to get other information, for example, to know if gzip compression is active.
In detail, for each page request, we will have the total time divided into:
DNS: indicated by the pink color, it corresponds to the time it takes to complete the DNS resolution process.

SSL: indicated in the waterfall graph by the color purple, equals the time it takes to complete the SSL/TLS handshake, a process that occurs only on sites that use the https protocol.

Connect: this is shown in light blue in the waterfall analysis, it indicates the time it takes to establish a TCP connection.

Send: the is indicated in orange in the graph, it equals the time it takes to send the request to the server.

Wait: the yellow in the graph, indicates the time it takes to receive the first data (in other words the time to first byte or TTFB).

Receive: this is shown in green in the waterfall, it corresponds to the time it takes for the browser to receive the data from the server.

Blocked: this is shown in gray in the graph, it represents the time it takes for the browser to be ready to complete a new request.

Pingdom: plans and prices
With the free version of Pingdom we can analyze our site, however there are some limitations.
For example, we cannot run tests by simulating connection from mobile devices or setting a different connection speed. This prevents us from having any idea of the site loading time that a visitor using, for example, a 3G connection has.
Unlike GTmetrix, the free version of Pingdom tools does not allow us to set alerts for the site.
Pingdom’s paid plans start at €8.33 per month with an annual subscription or €13 per month with monthly payment. Subscription plans allow us to monitor site speed, transactions and uptime, as well as implement a system of email or SMS alerts in case of site problems.

With the Real User Monitoring plan you can also access statistics and metrics related to real visitors to your site.
You can also test the features of paid plans with a 30-day free trial.
Conclusion
In this article, Pingdom: the definitive guide, we have seen how to use Pingdom to analyze the speed of our site. The tool, in addition to providing us with indications of page load time, also helps us identify the resources that place the greatest burden on load times and points us to valuable suggestions for improving site performance.
In addition to the free version of the tool, Pingdom also provides monthly or annual plans that allow us to track site uptime and improve user experience by analyzing actual data from site visitors.
What about you, which tool do you use to test your website’s performance? Let me know in the comments below.
Ready to build your WordPress site?
Try our service free for 14 days. No obligation, no credit card required.


