

If your website feels slow or clunky, your visitors will leave. That’s why speed and performance matter so much. But if your site is slow, how do you know what to fix?
Google PageSpeed Insights is one of the best tools for checking how fast your site loads and finding ways to fix it. It’s free, easy to use, and full of helpful suggestions.
In this guide, we’ll walk you through what it is, how it works, and how to improve your score without the help of a developer.
Table of Contents
What is Google PageSpeed Insights?
Google PageSpeed Insights is a free tool that checks how fast your website loads. It gives you a score from 0 to 100 and suggests ways to improve speed and performance.
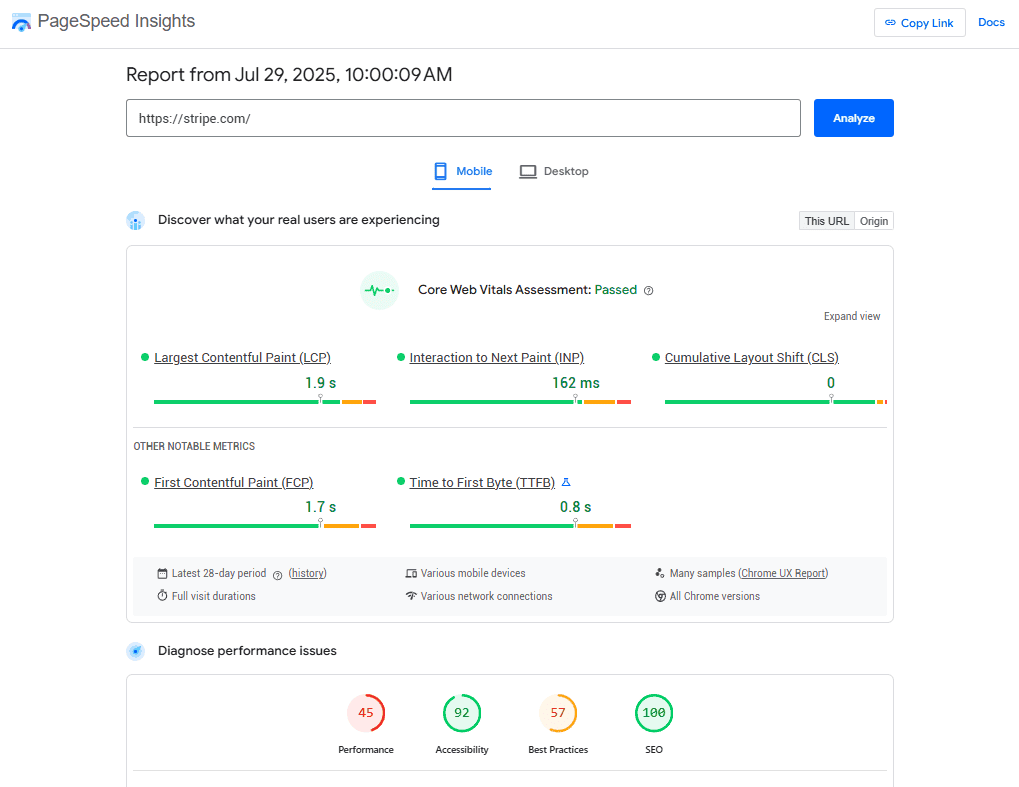
You don’t need to install anything. Just go to PageSpeed Insights, enter your website URL, and hit Analyze. The tool shows results for both mobile and desktop.
It also explains what’s working well and what could be better. You’ll see things like how long it takes for your page to load, how quickly people can interact with it, and what parts of the site may be slowing it down. It gives recommendations for SEO and accessibility as well.
Some of the suggestions might sound technical, but many are easy to fix. For example, you might need to reduce image sizes or remove extra code. If you’re using WordPress, plugins and hosting features can help with most of these tasks.
PageSpeed Insights is useful because speed matters. A faster site keeps visitors around longer and helps with search rankings. Even a few small changes can make a big difference.
Scoring in Google PageSpeed Insights
Google PageSpeed Insights gives your site a score between 0 and 100. This number shows how well your site performs in a given category. A higher score means your site performs better and is easier for visitors to use.
The score comes from real-world data and lab tests. Real-world data shows how actual users experience your site. Lab tests check your site in a controlled environment to spot problems.
Here is how the scores break down:
- 90 to 100 is great. Your site is fast.
- 50 to 89 is average. There is room for improvement.
- 0 to 49 is poor. Your site is slow and needs fixes.
The score is based on various Google metrics. Each metric has its own weight, so some factors affect your score more than others.
Your score can change between mobile and desktop. Mobile tests are often stricter because mobile networks and devices can be slower. It’s smart to always check both scores to see where improvements are needed.
How Google Uses PageSpeed Insights
While Google PageSpeed Insights is a tool for website owners, it also helps Google understand how fast and user-friendly your site is.
The Core Web Vitals in the report are part of Google’s ranking system. That means your scores can affect where your site shows up in search results. If your site is fast and stable, it may rank higher. If it’s slow or clunky, it could fall behind faster sites.
Google wants users to have a good experience. Sites that load quickly, respond fast, and don’t jump around on the screen are more likely to keep people engaged. That’s why speed is one of many signals Google uses when deciding search rankings.
Keep in mind that Google PageSpeed Insights doesn’t directly control your rank. It’s one of several tools that show how well your site performs. Still, improving your scores is a smart way to boost both user experience and SEO.
Taking a Balanced View
It’s important to take a balanced view when you start addressing Google PageSpeed Insights’ recommendations. You don’t have to do everything it suggests. Nor do you have to remove all of the elements that make your site function.
For instance, suppose PSI flags your homepage hero image as dragging on your performance. That doesn’t mean you have to remove it. You could try compressing the image, using a next-gen format (like WebP or AVIF), or trim down whatever CSS and scripts it uses. There are plenty of ways to make improvements that you should try before you start deleting elements.
Core Web Vitals of Google PageSpeed Insights
The first section of a Google PageSpeed Insights report is the Core Web Vitals Assessment. To be more important than the performance core because it includes metrics that Google uses to evaluate your page speed and rank your website.
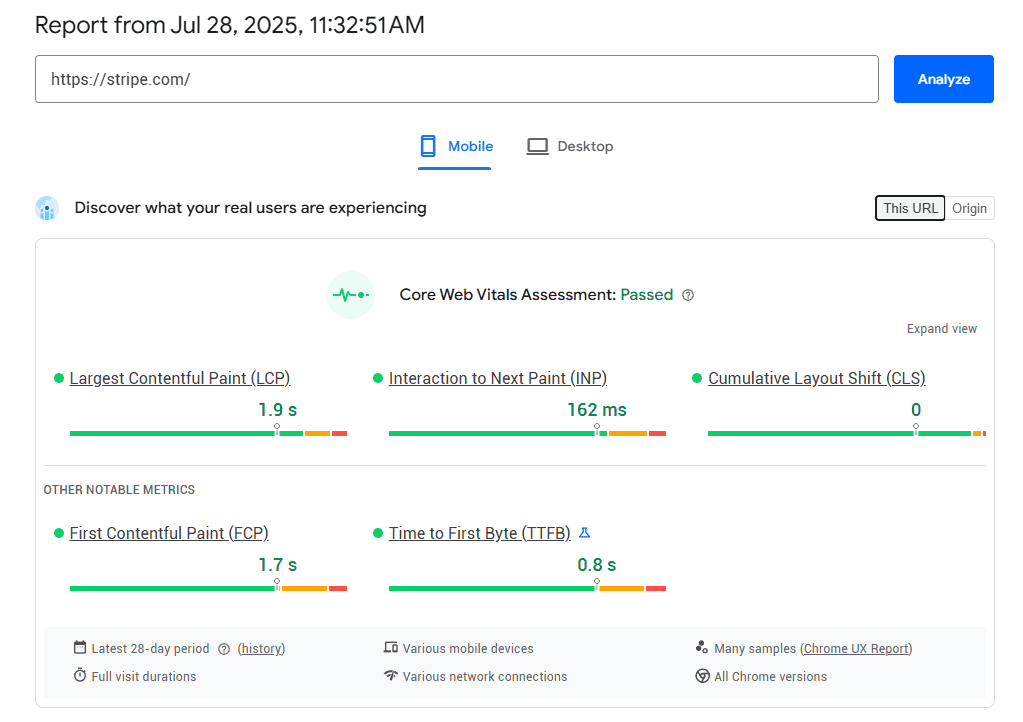
If your Core Web Vitals are in good shape, it means Google sees your site as fast and user-friendly. That’s why it’s worth focusing on these numbers.
Here’s a simple breakdown of each Core Web Vital:
Largest Contentful Paint (LCP)
LCP measures how long it takes for the largest visible part of your page to load. This is usually a big image, heading, or section that appears above the fold. It helps show when your main content is ready.
A good LCP score is under 2.5 seconds. If it takes longer, your site will feel slow to users, even if other parts are loading in the background.
Common causes of a slow LCP are large image files, slow server response, and render-blocking scripts or styles. You can improve LCP by compressing images, using faster hosting, and reducing unnecessary scripts.

First Contentful Paint (FCP)
FCP tracks when the first piece of content appears on the screen. This could be text, an image, or anything other than a blank page. It gives users a signal that the site is starting to load.
A fast FCP makes your site feel more responsive and prevents users from feeling stuck. A good score is under 1.8 seconds, but that can be slowed down by heavy fonts, unused CSS, or delayed rendering.
To improve FCP, try preloading fonts, reducing unused code, and minimizing external stylesheets.

First Input Delay (FID)
FID measures how long it takes for your site to respond when someone first interacts with it. That could be a click, tap, or key press. It only uses real-world data (not lab tests) so it shows how people actually experience your site.
A good FID score is less than 100 milliseconds. A long delay tends to make users think your site is broken or unresponsive. Common problems include heavy JavaScript files and tasks that block the main thread.
You can address FID by reducing JavaScript execution time and splitting large tasks into smaller ones.

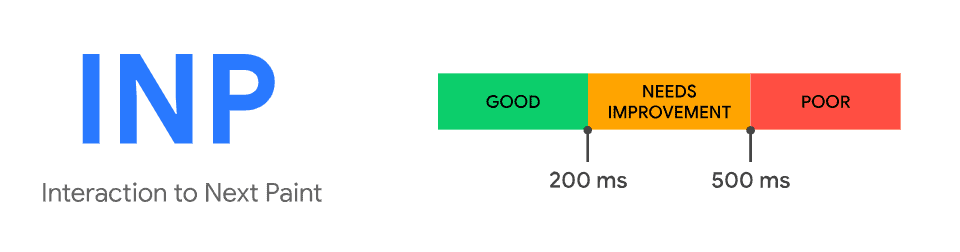
Interaction to Next Paint (INP)
INP is replacing FID as the main way to measure responsiveness. It doesn’t just look at the first interaction. It measures how long your site takes to respond across multiple actions during a visit.
A good INP score is under 200 milliseconds, but lower is always better. A high INP means users may experience lag or feel like buttons aren’t working right away. That can be frustrating and lead to more people leaving your site.
To improve INP, avoid long tasks that block input, keep JavaScript lean, and use browser-friendly animation and effects.
Cumulative Layout Shift (CLS)
CLS tracks how much your page layout shifts while it’s loading. A layout shift happens when elements move after they appear on the screen. This can cause people to click the wrong thing or lose their reading place, especially on mobile.
A good CLS score is under 0.1. Anything higher means your page may feel jumpy or unstable. This is typically caused by images without set dimensions, ads or embeds that push content down, and fonts that load late and change spacing.
You can reduce CLS by setting width and height for images and videos, loading content in a predictable way, and reserving space for ads or embeds.

Time to First Byte (TTFB)
TTFB measures how long it takes for your browser to get the first response from the server after making a request. In simple terms, it tracks how quickly your website starts to load.
A fast TTFB means your server is responding quickly. A slow TTFB means your site is stuck waiting before anything even begins to load. Here’s what affects TTFB:
- Slow hosting
- Too many redirects
- Heavy plugins or themes
- Server location (if it’s far from the visitor)
Ideally, your TTFB should be under 200 milliseconds. If it’s higher, your site may feel sluggish before the page starts to show. You can improve TTFB by using a fast web host (such as SupportHost LiteSpeed), enabling caching, and using a content delivery network (CDN).

Google PageSpeed Insights Diagnostics Section
The Diagnostics section gives you a comprehensive overview of your site in regards to performance, accessibility, best practices, and SEO.
Performance
The Performance tab gives you a full breakdown of how your website loads and runs. You’ll see details on what’s working and what needs improvement. There are three sections.
1. Metrics
The Metrics section shows your performance score and six key speed signals. These signals are used to calculate the performance score at the top.
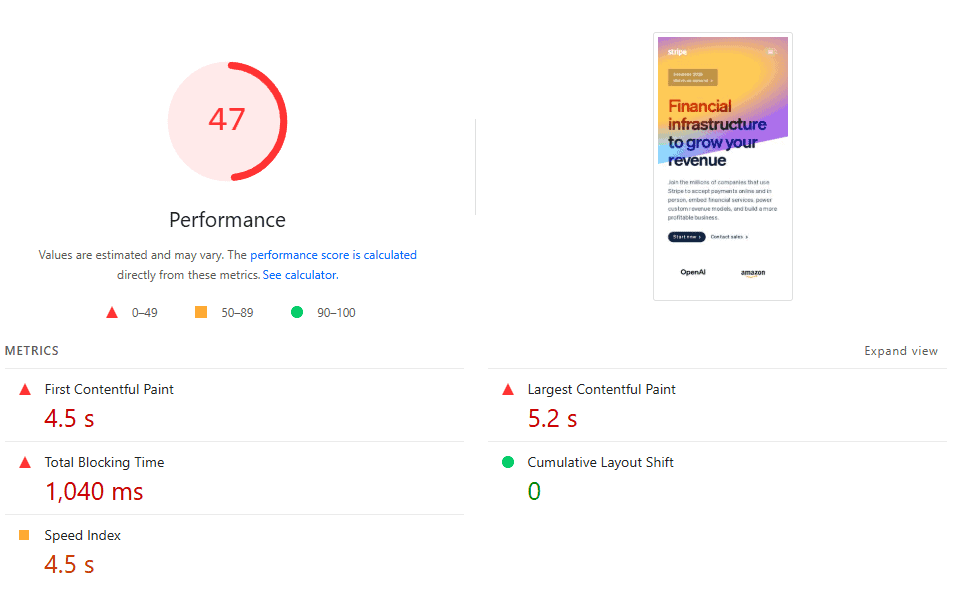
You can click the See Calculator link to learn more about how PSI incorporates the metrics into a total performance score.

These metrics are based on lab data, which means they’re measured in a controlled setting (not from real users). You’ll notice many of them from the Core Web Vitals Assessment.
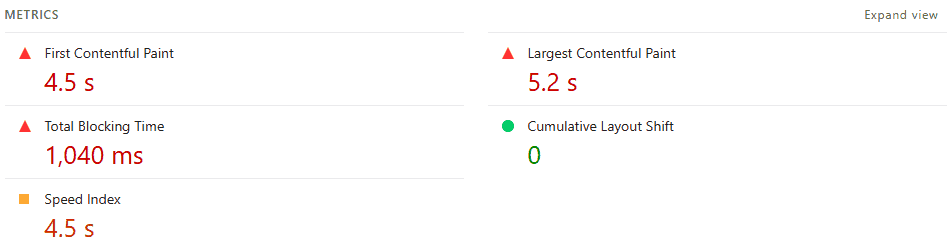
- First Contentful Paint (FCP) – When the first content shows up.
- Largest Contentful Paint (LCP) – When the biggest visible element loads.
- Speed Index – How quickly everything becomes visible.
- Time to Interactive – When the page is fully ready to use.
- Total Blocking Time (TBT) – How much time is lost to unresponsive scripts.
- Cumulative Layout Shift (CLS) – How much your layout moves around as it loads.
Each metric includes a score, time value, and color to show how you’re doing (green is good, orange is okay, red needs work).
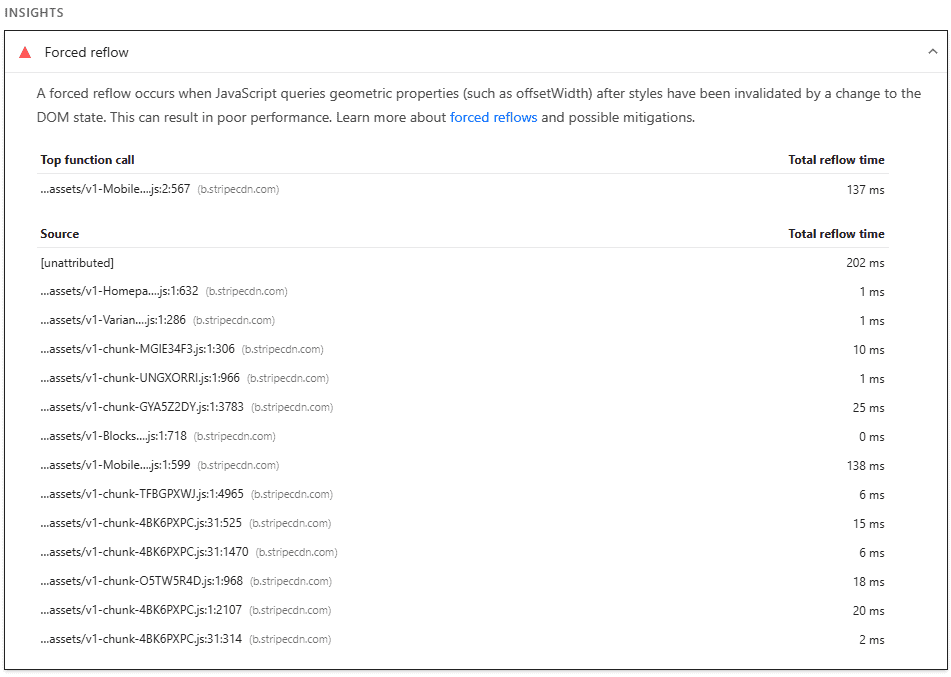
2. Insights
Below the metrics, you’ll see Insights. This section points out what’s slowing down your site the most. In some cases, PSI even estimates the time savings you can achieve by fixing the issue.
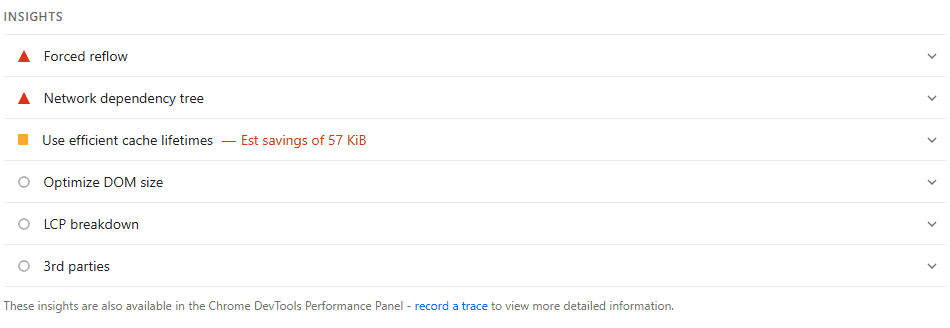
You can expand each list item to learn more about the problem and what to do about it. Notice in this example that PSI links directly to the scripts that need attention.
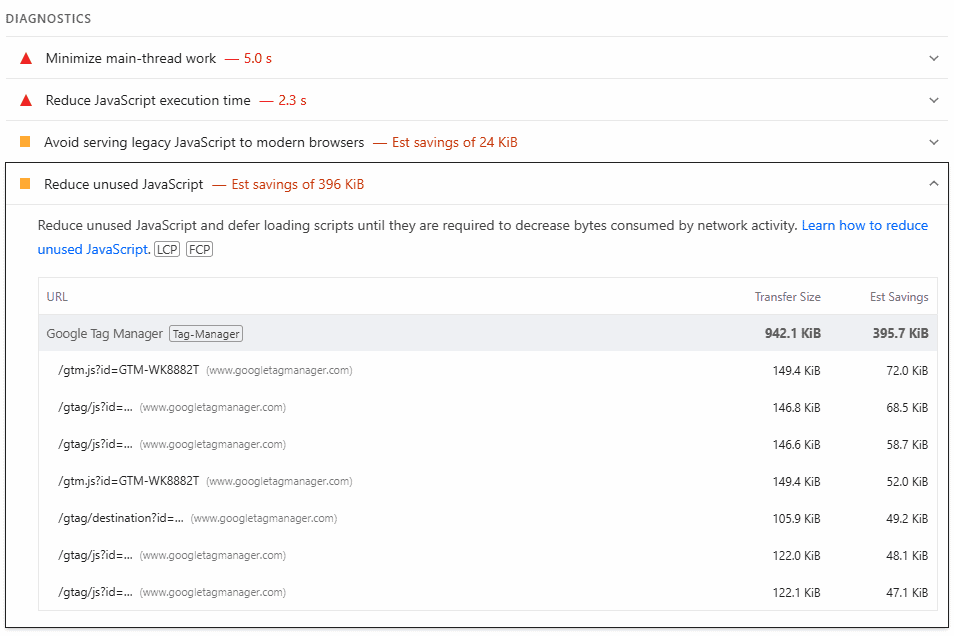
3. Diagnostics
The Diagnostics section gives you even more details about how your page behaves and specifically how to make it better. These aren’t factored into your performance score, but they still matter.
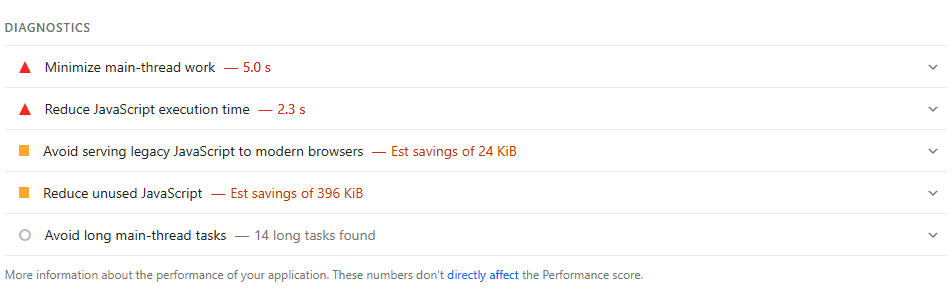
Expanding a list item gives you more information about the steps you should take to improve performance. In this example, if we expand the “Reduce unused JavaScript” list item, PSI tells us exactly which scripts could be removed or deferred to the end of the loading process.
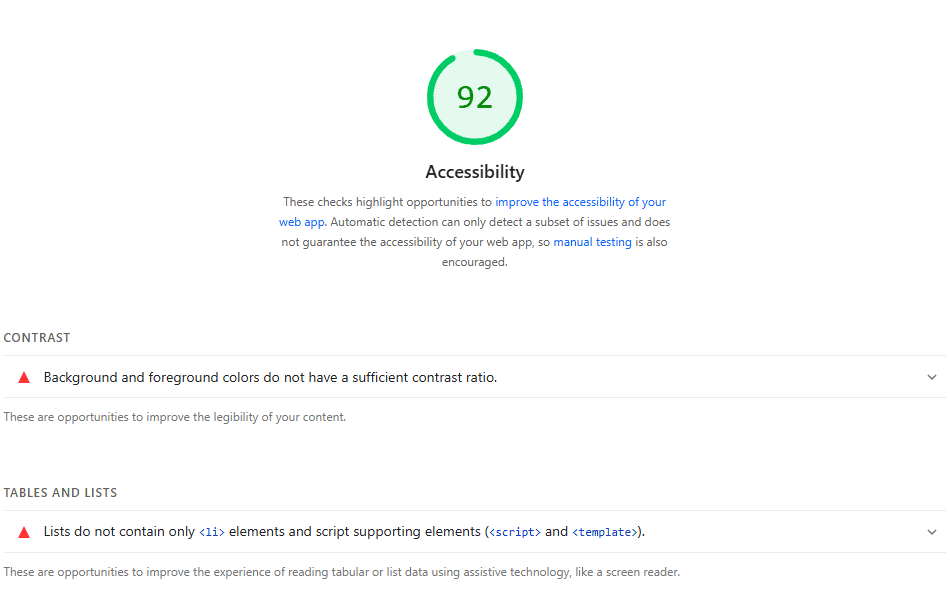
Accessibility
The Accessibility section in PageSpeed Insights checks how easy it is for all users to use your website, including people with disabilities. These checks help make sure your site works well for everyone, including those using screen readers or keyboard navigation.
Depending on your industry, accessibility may be a requirement for you. You shouldn’t use this score to measure your compliance, but it’s a helpful tool to point you in the right direction.
This section gives you a score out of 100, just like the Performance section. A higher score means your site is more accessible. It also lists problems that could make it harder for people to use your site.
Here are some of the most common things it checks:
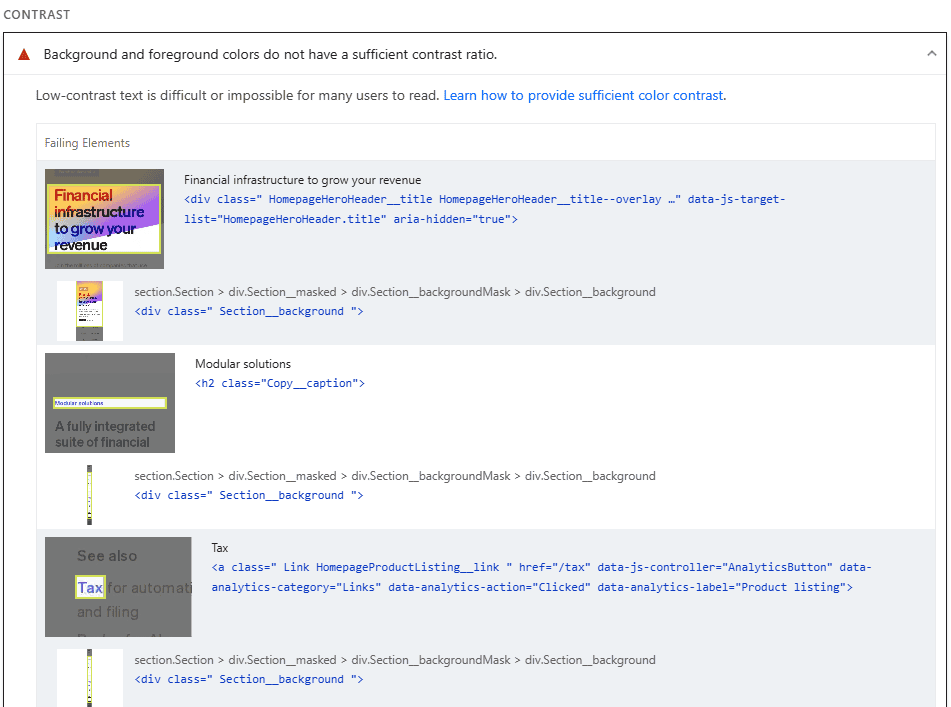
- Contrast between text and background: Text needs to be easy to read. If your background and text colors are too close, people with vision problems or people reading on small screens may not be able to read it.
- Alt text for images: If an image doesn’t load or a user relies on a screen reader, alt text helps describe what the image is about.
- Clickable elements: Buttons and links should be easy to spot and click. If they are too small or placed too close together, it can cause problems, especially on mobile.
- Form labels: Every form field should have a clear label. This helps users know what to enter into the field, especially if they’re using assistive tech.
- Headings and structure: Your site should follow a clear heading structure (H1, H2, H3, etc.). This helps screen readers scan the page and understand the content.
- Keyboard navigation: Users should be able to move through your site using only the keyboard. That means all buttons, links, and forms must be focusable and usable without a mouse.
- ARIA roles and landmarks: These are special tags that give extra context to assistive tools. They help define page sections like menus, banners, or main content.
Each problem comes with details and advice. If your score is low, it doesn’t mean your site is broken. It just means there are changes you can make to help more people use your site easily.
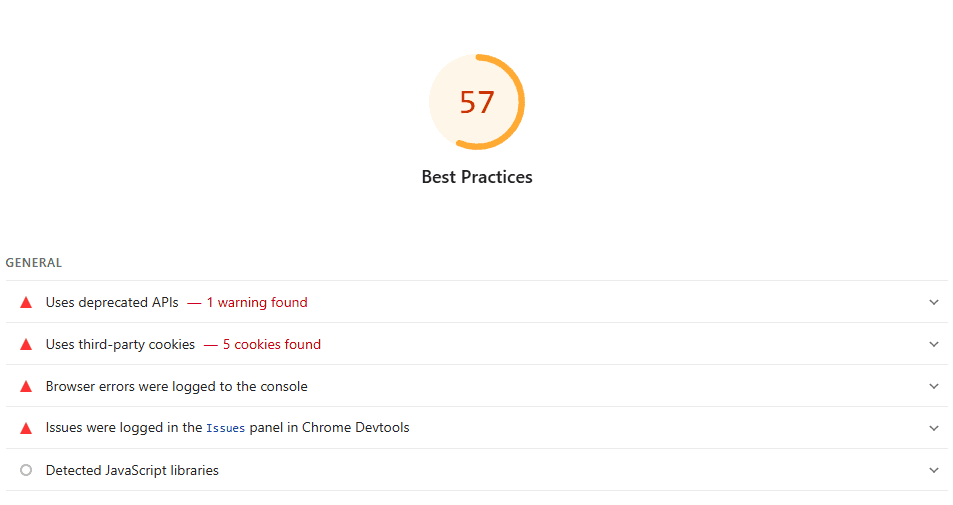
Best Practices
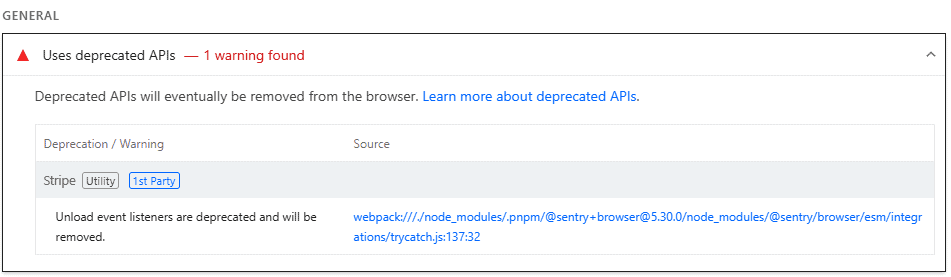
The Best Practices section checks how well your site follows general web standards regarding safety, reliability, and overall site quality. No, these best practices won’t make your site load faster or rank higher, but they will help prevent bigger problems down the line.
Suppose your site uses an old JavaScript feature that most modern browsers still accept, but won’t support forever. If that feature gets removed in a future browser update, your site might stop working correctly for a lot of users. Fixing it early can avoid a sudden drop in traffic or broken pages later on.
Like the other sections, you’ll get a score out of 100. If your site uses risky or outdated features, they will be flagged. Each item includes a short explanation and sometimes a link for more info.
SEO
The SEO section checks whether your site follows basic search engine optimization rules. It doesn’t measure your rankings, but it looks for common issues that might make it harder for search engines to understand or find your content.
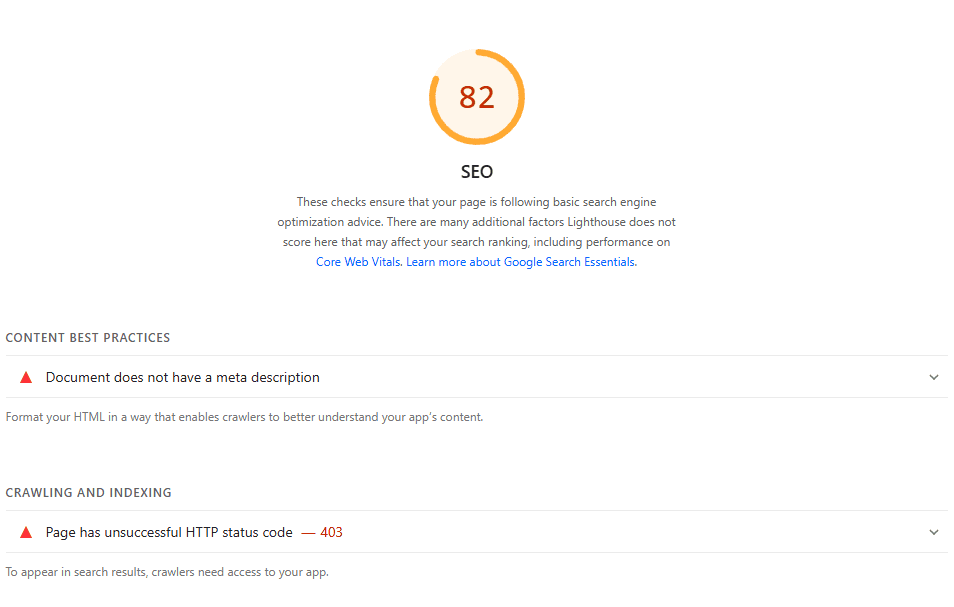
A perfect 100 score means your page follows best practices that help with visibility in search results. Here’s what it looks for:
- The page isn’t blocked from indexing.
- The document has a <title> element.
- The document has a meta description.
- Page has a successful HTTP status code.
- Links have descriptive text (not “click here”).
- Links are crawlable.
- robots.txt is valid.
- Image elements have [alt] attributes.
- Document has a valid hreflang.
- Document has a valid rel=canonical.
- Structured data is valid.
Like the other sections, expanding a list item gives you some more information about why it’s relevant and how to fix the issue.
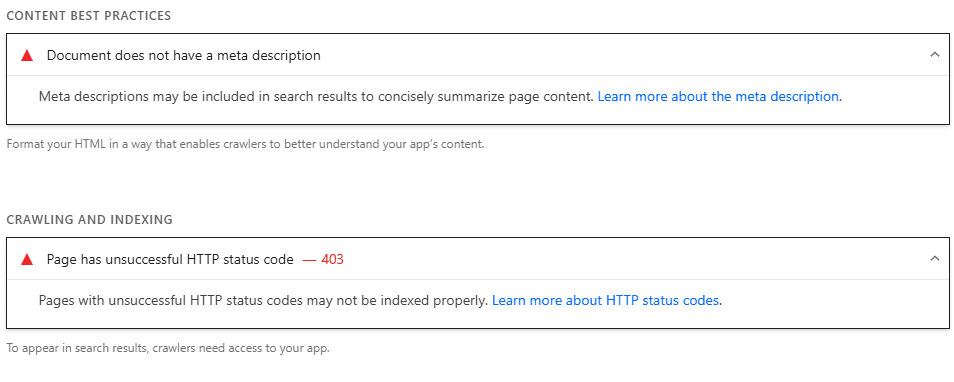
These are basic checks, but they matter (and they’re usually easy to fix). If search engines can’t easily read or index your page, it could hurt your rankings. Fixing any reported issues gives your site a better chance to show up in results.
10 Ways to Improve Your Google PageSpeed Insights Scores
If your PageSpeed score is lower than you’d like, you’ll need to take a few steps to fix it. The following improvements will raise your PageSpeed Insights score and make your site faster and more enjoyable for users.
1. Optimize Your Code (CSS and JavaScript)
Clean up your CSS and JavaScript files by removing anything you’re not using. Minify your code to shrink file sizes, and use defer or async to load non-critical scripts at the end of the loading process. This improves metrics like LCP and Time to Interactive.
2. Enable Caching and Compression
Make sure your server uses caching and compression. Caching lets browsers save parts of your site so they load faster next time. Compression tools like GZIP or Brotli shrink file sizes before they’re sent to visitors. Both can cut load time by seconds.
3. Reduce External HTTP Requests
External scripts (like fonts, ads, or trackers) add more steps in the loading process, which slows down your site. Only load what you really need and remove anything that isn’t helping your site or your users.
4. Resize and Compress Images
Big images are one of the top reasons for slow sites. Take steps to optimize your images, by resizing them to fit your layout, using modern formats like WebP, and compressing them without losing quality. You should also set image dimensions to avoid layout shifts as the page loads.
5. Use Lazy Loading for Media
Lazy loading makes your site load images only when users scroll down to them. This keeps the initial page load light and fast, especially on mobile devices. It’s a simple change that can make a big impact.
6. Improve Server Response Time
If your site is slow even before anything appears, your server might be the problem. A fast host (such as SupportHost LiteSpeed), a CDN, or a more efficient backend setup can reduce Time to First Byte (TTFB) and get your content to users quicker.
7. Fix Render-Blocking Resources
Some CSS and JavaScript files stop your page from loading right away. These are called render-blocking resources. You can fix this by loading only the essentials first and delaying everything else. Tools like defer, async, or critical CSS can help.
8. Load Fonts the Right Way
Custom fonts can cause delays. Preload important fonts or use font-display: swap. Whenever possible, just go with system fonts. This keeps your text visible and your layout stable.
9. Limit WordPress Plugins
If you use WordPress, keep an eye on your plugins. Too many can slow down your site, especially if they add scripts or styles to every page. Remove plugins you don’t need. When you must use a WordPress plugin, choose lightweight ones that are built for performance.
10. Focus on Mobile Experience
Mobile scores are often lower than desktop because mobile devices are slower and have smaller screens. Use a responsive design, increase tap target spacing, and avoid elements that shift or overlap. It’s always best to review your site on a real phone, not just your computer.
PageSpeed Insights Alternatives
Google PageSpeed Insights is a great tool, but it’s not the only one out there. If you want different views of your site’s performance, these alternatives offer extra features and deeper testing.
GTmetrix

GTmetrix shows how your site loads and breaks everything down step by step. It gives you a performance score and shows waterfall charts. We like how it highlights bottlenecks.
This tool lets you test from different locations and browsers, which is helpful if you have a global audience. GTmetrix also stores past test results so you can track your progress over time.
Learn more in our full GTmetrix guide.
WebPageTest

WebPageTest is another speed testing tool. It runs detailed tests and lets you choose things like location, browser, and connection type. You’ll get a filmstrip view of how your site loads, along with Core Web Vitals and performance grades.
This one is a bit more technical than other tools, but the insights are worth it if you want full control.
Comparison: Page Speed Insights, GTmetrix, and WebPageTest
| Feature | PageSpeed Insights | GTmetrix | WebPageTest |
| Free to Use | (with premium options) | ||
| Performance Score | |||
| Core Web Vitals | |||
| Mobile Testing | Limited (mobile simulation) | (real device testing) | |
| Test Location Options | (uses Google servers) | ||
| Waterfall Chart | |||
| Historical Reports | (with account) | (manual setup) | |
| Filmstrip/Video View | |||
| Custom Test Settings | Some (with account) | (full control over settings) | |
| Ease of Use | Very Easy | Easy | Medium (more advanced options) |
Google PageSpeed Insights FAQs
How do I download a Google PageSpeed Insights report?
You can’t directly download a report as a file, but you can copy the results or print the page as a PDF. On most browsers, press Ctrl+P or Command+P and choose Save as PDF to keep a copy.
Does PSI affect my Google ranking?
Not directly, but it measures Core Web Vitals, which do affect ranking. A better PSI score usually means faster load times and a smoother experience, both of which help keep users on your site and improve SEO.
Is a score of 100 necessary?
No. A perfect score isn’t required. Aim for scores in the green zone (90 and above) if possible, but focus more on user experience than chasing a number. Even a score in the 80s can be good if your site feels fast.
How does Google PageSpeed Insights work?
Google PageSpeed Insights runs tests on your web page using lab data and real-world user data from the Chrome User Experience Report. It then gives a performance score and shows what’s helping or hurting your speed.
How can I use Google PageSpeed Insights for mobile optimization?
Enter your URL and review the mobile section of the report. Mobile scores are based on slower connections and smaller screens, so even small changes can help a lot.
How do I improve my Google PageSpeed Insights score?
Start by fixing high-impact issues like large images, unused code, and long script load times. Use caching, a content delivery network, and fast hosting. Focus on the Core Web Vitals for the best results.
Why are my PSI mobile and desktop scores different?
Mobile tests are stricter. They use slower network speeds and lower-powered devices to simulate real-world use. Even if your site feels fast on a desktop, it may need work to perform well on mobile.
Final Thoughts
Google PageSpeed Insights gives you a clear look at how your site performs and what you can do to make it faster and easier to use. Some changes take minutes, while others take more work, but every step helps. Improving your site’s speed will improve your SEO and create a better user experience for your visitors.
Leave a Reply