The performance of your website influences visitors, conversions and its ranking on Google.
In this article, we’ll look at a variety of data that will help us understand how your site’s performance affects its success.
Table of Contents
The benefits of a fast website
But first, let’s get to the gist of it: why is it important for your website to be fast?
What are the benefits to the site owner?

Improve user experience
The main reason to enhance and improve the page loading time of your web site is to provide a better browsing experience to your users.
As we will see in the next paragraph, a low-performing site is not so frequently visited.
Most websites try to create interesting content with catchy graphics, but if you want to make a good first impression your site needs to load fast.
Your users need a fast site to navigate and explore your content.
A Google study reported that a 1-second delay reduces your visitors’ satisfaction by 16% and 79% of visitors will not buy from you if they are not satisfied with your site’s overall performance.
75% of users will not return to a site if the page takes more than 4 seconds to load.
Visitors also don’t feel confident buying from a slow loading website. A slow site is linked to inefficiency.
I will explain in more detail where I talk about how loading time affects conversion rate.
Let’s see how loading time affects your visitors’ behavior first.
Reduce the bounce rate
We’ve all heard that our website pages should load in less than 2 seconds. In 2016, John Mueller of Google said that 2-3 seconds is the time limit that your visitors are willing to wait for your website’s pages to load. A study by section revealed how bounce rate increases based on loading time.
The bounce rate is the percentage of users who leave your site after a few seconds without visiting any other pages.
In their infographics, you can see that with loading times of 2 seconds, the bounce rate is 9.6% and it rises to 32.3% as soon as loading times reach 7 seconds.
A study by pingdom reveals similar results, revealing that as the page loading time increases, the bounce rate increases as well.
Increase the number of page views
In addition to reducing the bounce rate, which means as the page loading time increases, the number of page views per visit decreases.
For a site that loads in 2 seconds, we have 9 page views per visit, versus 3.3 pages per visit in the case of a site that loads in 8 seconds.Which means that, if you increase the speed of the pages you reduce the bounce rate and increase the number of page views per visit.
Basically, the same number of visitors stay longer on your site.This improves your conversion rate. Here’s how.
Improve the conversion rate
A study conducted in England showed that 67% of users abandon their purchase on a slow site.
A Google study showed that a half-second delay in page loading causes a 20% loss of traffic, while a one-second delay causes an 11% decrease in page views per visit.
In addition, a 1-second increase in page loading time improves conversion rates by 10% to 20%.
An additional study done in 2017 by akamai shows that 50% of users search for new products or services from a mobile phone (with the speed on mobiles being an even more crucial factor) and a 100 millisecond delay can worsen the conversion rate by up to 7%.
Another study done by the Aberdeen Group shows us that a delay of 1 second costs 7% in conversions.
Optimal conversion is reached at 2 seconds
Nielsen, 1997
Aliexpress reduced load times by 36%. This resulted in a 10% increase in orders and a 27% increase in conversion rate.
Conversion rate at checkout
When it comes to checkout, the loading time is even more crucial.
For 46% of users, the speed of the checkout process is the number one factor in deciding whether they will return to the site or not.
44% of users worry about the outcome of the transaction if a checkout page takes too long.
64% of users decide to buy their products elsewhere if they are not satisfied with the experience they have while visiting the site.
43% go to a competitor’s site if they aren’t happy with the mobile shopping experience.
A test by Amazon showed that a 1-second delay in page loading times would result in a loss of $1.6 billion per year.
In the UK, the railroad company reduced latency by 0.3 seconds in their onsite sales funnel. This increased revenue by £8 million each year.
The success of an e-commerce site depends largely on the kind of user experience you’re able to deliver and this is especially true when it comes to mobile phones.
Loading speed and SEO
Loading speed has been part of Google’s ranking drivers since 2010.
Since 2016, the loading speed on mobiles influences the ranking of sites on mobile phones.
Among other ranking factors Google also checks bounce rate and page views.
If a site has a high bounce rate and a low number of page views per site it makes Google understand that the site doesn’t satisfy the user’s request and so in time it will lower that site in the search results.
As we have seen the loading times increase the bounce rate, if your site loads slowly it could have a loss of position on the Google search results.
If you have a slow site and you improve its performance you will have a lower bounce rate and consequently, have higher chances of your page reaching a top position on Google.
A lengthy loading time will affect the crawling this means that Google’s bot will take longer to scan the pages of your website. If your site is fast Google will be able to crawl multiple pages at the same time.
A fast site has more conversions, a lower bounce rate and a better user experience overall. All factors that Google takes into consideration in one way or another.
Remember, in addition to site speed, there are other factors to consider while doing a site SEO analysis. As for images, for example, compressing them increases site speed, while optimizing images for SEO improves indexing.
How to test the speed of a website
There are various online tools that allow us to test the performance of a website, first and foremost GTmetrix and pingdom. Both are excellent tools for measuring the performance of a website, but they provide us with different results due to the way they perform their measurements, which we will see in the next paragraphs.The real advantage of GTmetrix, when compared to pingdom, is the amount of information it gives to help improve site optimization. That’s why in the guide explaining how to speed up WordPress I use GTmetrix tests to understand what needs to be optimized.
NOTE: If you want to run a test on your website you need to set the location of the test server. The default setting on Gtmetrix is Vancouver, Canada. You need to register for a free account in order to use the test server in London, so you can have a more accurate test. In any case, you need to choose the location of the test server so that it is as close to your server as possible.
Before we talk about how we can measure the speed of a website let’s see in detail what is measured by various online tools. If we run a test with GTmetrix at the “Timings” tab we will see the following graph

Let’s look at the different steps in detail.
Redirect
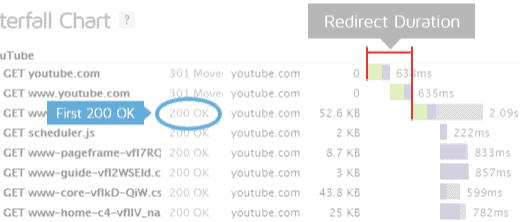
The main rule when running a speed test is to run it on the final url.
What does that mean?
Let me give you a practical example. If you visit https://supporthost.com you are redirected to https://supporthost.com/. The fact is that we are redirected from http to https and a trailing slash is added in the url, the slash after the .it.
Obviously, these redirects require some time, thus distorting the result of the test. For this reason, we must make sure to test the final url.
In the image, we can see how the first two redirects affect the loading time of our site.
Connect
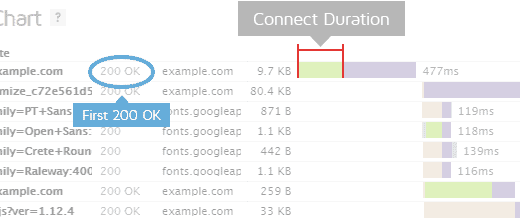
At this stage, GTmetrix includes three steps instead of only connect time: blocked time, DNS time and connect time.
GTmetrix combines these three measurements because these times are usually very low.
This time tells us how long it takes to connect to the server to request the web page.
Backend
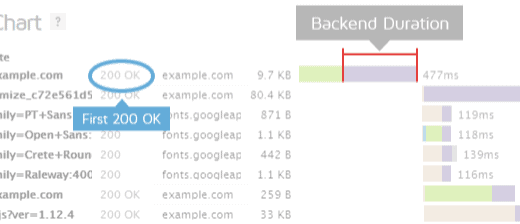
This parameter indicates how long it takes for the server to generate a response and send the code for the page.
To give a simple example, when you visit a site created in WordPress the server executes the php files of the core, theme, plugins, gets the information from the database and creates the HTML code of the page.
This is why too many plugins slow down WordPress and why a caching plugin helps us improve performance. The caching plugin creates HTML files that are then served to the visitor, without the need to perform any kind of calculation.
TTFB
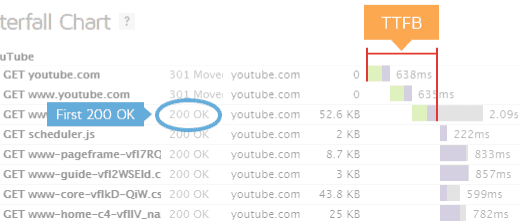
Time to First Byte is a very important parameter, that’s why we use it in all our comparisons.
This represents the total time to receive the first byte of data from the server and it is calculated by adding the 3 previous parameters: redirect, connect and backend.
First paint
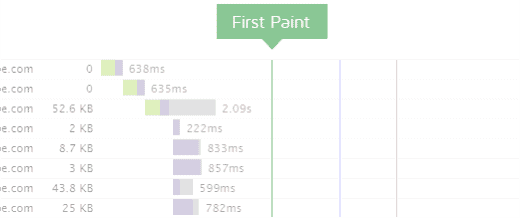
First paint is the moment when the browser starts rendering the page. That is, it displays the first contents.
Depending on how the page is structured in this phase we can only see the background or the page nearly complete.
Contentful paint
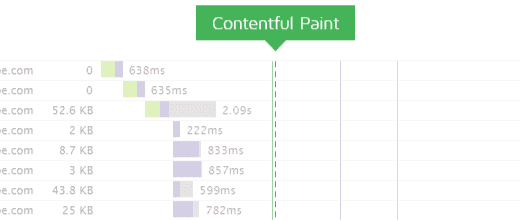
This period of time, which in many cases can coincide with the first paint, represents the time needed to show the first content on the web page.
Given the focus on content, this parameter allows us to understand when the user receives the first part of the information on our page.
DOM interactive
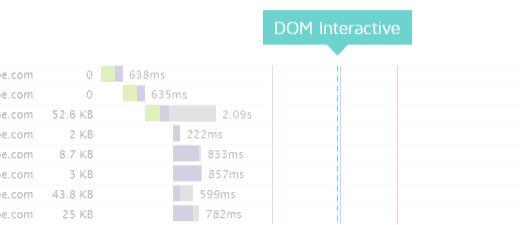
At this point the browser has finished loading the HTML page and is doing the parsing.
The DOM (Document Object Model) is completed at this stage.
On GTmetrix this parameter is not shown in the waterfall because of its proximity to the next parameter, the: DOM loaded.
DOM loaded
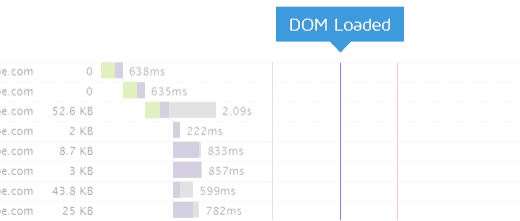
At this point the DOM is ready and no style sheets are blocking the execution of JavaScript.
This moment is often used by JavaScript as an event to start code execution.
In the “Timings” tab GTmetrix indicates in parentheses the time it takes for JavaScripts to execute that are executed in this event.
Onload
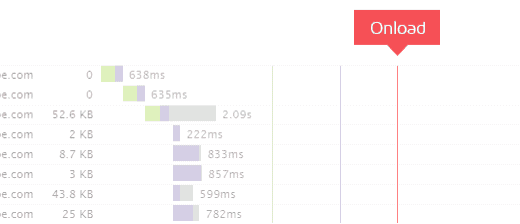
This time tells us when the content of the page has been processed and all resources have been downloaded from the server.
At this point, we have the JavaScript event window.onload
Once again this is a common event for launching JavaScript functions, and as with DOM loaded the time in parentheses indicates the time taken by these scripts.
Now that we’ve seen how to measure the speed of a site, what are the main factors that determine the speed (or slowness) of a site?
What factors determine the speed of a site?
This is not meant to be a guide to optimizing a website, but an overview that indicates where to place your focus if you want to optimize your website and transform it into a fast website.
The most important parameter to consider is the load time, which as mentioned above should be under 2 seconds. If you have higher load times check the GTmetrix waterfall to see what resources are slowing down the loading of your website.
Hosting
A crucial factor to having a fast site is to have a performing hosting. No matter how much you optimize the code of your website, if the hosting service you use is not performing, your site will never be fast.
This is why one of the strong points of our service is speed. If we are not able to provide you with a fast service your site cannot succeed.
HTTPS connection
The HTTPS protocol, in addition to being increasingly essential, supports HTTP/2, which provides greater performance since it allows simultaneous downloading of resources.With SupportHost you have the SSL certificate for free and active by default, so all you have to do is configure your CMS / site to properly use the HTTPS secure connection.
Page size
Page size depends mainly on images, JavaScript and CSS.
Often in purchased themes, the size of JavaScript and CSS are substantial and difficult to streamline without risking compromising the theme or losing hours and hours of work. In an average site 50% of the page weight is due to images, so it’s important to optimize the images.It would be desirable to be able to stay under 1MB, but unfortunately it is not always possible. There are several ways to compress photos and images for the web, for example you could use an online image optimizer like Optimizilla.
Number of requests
A request is the loading of a file. For example, an image is a request, a CSS file is a request and so on. In many cases WordPress themes and WordPress plugins (but also the core) load files on all pages, which are really needed only on one page, for example, CF7 loads its CSS and scripts all over the site while you need them only in the contact form. Alternatively, the WordPress core loads emojii and embed scripts on all pages even if you don’t use them.
You need to eliminate all unnecessary requests.
Ideally, you should have a maximum of 50 requests, which is not always possible.
PageSpeed and YSlow Score
GTmetrix also provides two different scores for our website. From a performance point of view checking PageSpeed and YSlow scores doesn’t make much sense, in the sense that it’s better to focus on loading time and reduce that.
It is also true that a site that has low scores will rarely have great loading times.
Don’t focus on getting high scores, but try to decrease loading times.
Site speed: what is our goal?
After seeing what the benefits of a fast site are, it is necessary to understand what our goal is when optimizing the site.
As I said before you can measure performance using GTmetrix, setting the test server closest to where the server hosting your site is located. In our case the datacenter is in Germany and USA so it is appropriate to use London as the test server.
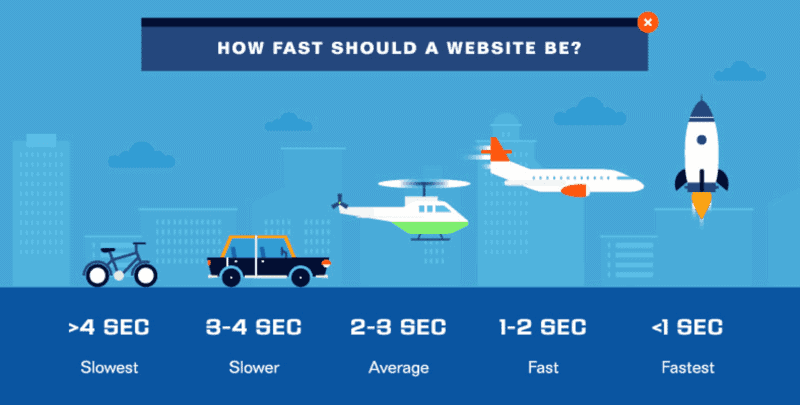
If your site loads in less than 1 second you have done a great job, any other optimization would have a minimal effect on the result while the work needed to improve further would be too much.
If your site loads in less than 2 seconds you perform better than most websites, and you can be satisfied.
If the loading time of your pages exceeds 3 seconds you need optimization work, which is more or less important depending on the loading time. It is obviously easier to go from 3 seconds to 1.5 than to go from 18 seconds to 2.
Average data of loading times on the web
But what are the average loading data on the web? Let’s make a comparison of the sites to understand what our site is like.
Brian Dean with his team analyzed 5.3 million websites and found the following average data:
Desktop | Mobile | |
|---|---|---|
TTFB | 1.3 s | 2.6s |
DOM loaded | 8.2 s | 21.6 s |
Onload | 8.9 s | 23.6 s |
Page loaded | 10.4 s | 27.4 s |
GTmetrix published a list of the 1000 sites with the most traffic worldwide, again we can see that most of them have loading times above one second. NOTE: the list has been removed now, but the data stays valid.
We see that on average site loads quite slowly, so if we can make our site load in less than two seconds we will have a better chance of success.
Conclusion
We’ve seen what benefits a fast loading site brings.
We’ve seen how to measure your site’s performance and what are the key factors that determine its speed.
We then saw what kind of results we should aim for if we want our site to be successful.
Have you ever run a test of your website? How many seconds does it take to load? Do you think you could improve conversions if you could decrease the loading time?
Let me know in the comments below!
Ready to build your WordPress site?
Try our service free for 14 days. No obligation, no credit card required.

