
Google Analytics 4 is a powerful tool, but simply installing it isn’t enough. To get real value, you need to know what to track, where to look, and how to turn its data into action.
In this guide, we’ll explain how to use Google Analytics and everything else you need to know.
Table of Contents
What is Google Analytics 4?
Google Analytics 4 (also called GA4) is the latest version of Google’s free tool for tracking what people do on your website. It replaced the old version in 2023. It’s used by more than 28.8 million websites.
GA4 tracks actions like page visits, clicks, and form submissions so you can see how people actually use your site. It also works across websites and apps so it’s easy to see everything in one place.
GA4 keeps your data safe and organized so you can understand what you’re looking at, even if you’re not a data expert. You can set it up using a plugin or Google Tag Manager without any coding.
Why Use Google Analytics 4?
Google Analytics helps you understand what’s happening on your website. You can see how many people visit, where they come from, what pages they view, and how long they stay. It can even show you their path through your site, ecommerce conversions, and more.
You can also track goals, like sales, signups, or button clicks. This helps you figure out which pages or marketing efforts bring the best results. It’s free, easy to set up, and gives you the info you need to grow your site.
How Does Google Analytics Work?
Google Analytics works by tracking events on your website or app. An event is any action someone takes, such as accessing a page, clicking a button, submitting a form, or purchasing a product.
Google Analytics collects this data and turns it into reports so you can see what’s working and what’s not.
How Google Analytics Works Step by Step
- Tracking code: You install the GA4 tag on your website using a plugin, Google Tag Manager, or by adding the code manually.
- Cookie installation: When a user visitors your site, Google Analytics adds a cookie to their device. This stores data about the user’s use of your site.
- Data collection: Google Analytics collects, stores, and organizes the data based on user behavior, location, device, and more.
- Metrics and reports: You log into your Google Analytics account to see real-time info about your site.
How to Set Up Google Analytics
Before we show you how to use Google Analytics, you first need to set it up. Fortunately, this isn’t difficult. Let’s walk through the steps.
Step 1. Create Your Google Analytics Account
Go to Google Analytics and click the Get Started button.

Enter an account name (like your website or business name) and choose your data-sharing settings. Click Next to create a property.

Enter your website name, select your time zone and currency, then click Next again.

Choose your industry and business size, then click Next.

Tell Google Analytics how you intend to use their service. Choose as many objectives as you like. This helps GA4 configure the dashboard to meet your needs. Then click Create at the bottom.

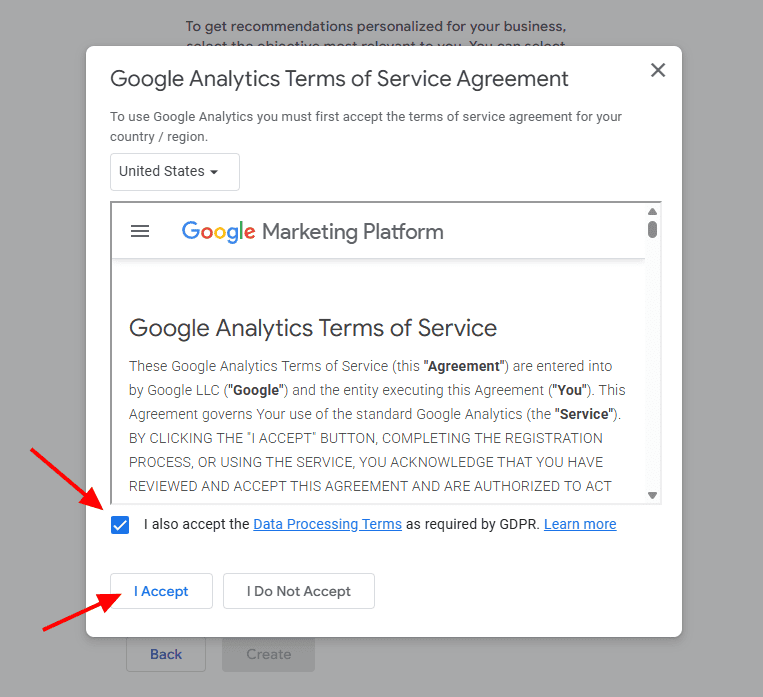
Accept the terms of service by clicking I Accept. You may also be required to check the box for “I also accept the Data Processing Terms as required by GDPR.”
Choose the platform that GA4 will track. If you need to track multiple sources, you can add those properties later.

Enter your website’s URL and name. Then click Create & Continue.

Google Analytics will take you to the next step: adding your GA Tag to your website.
Step 2. Add the GA Tag to Your Website
Visit Google Tag Manager. Click into the Google Tags tab and choose the site you want to track.

This is where you configure the settings of your Google Tag. You can edit these parameters at any time. For now, click on Installation Instructions.

There are two ways to add the Google Tag to your website: Manually or through an integration with your CMS (such as WordPress or Shopify).
Installing the Google Tag Manually
To install the tag manually, toggle to the Install Manually tab and copy the installation code.
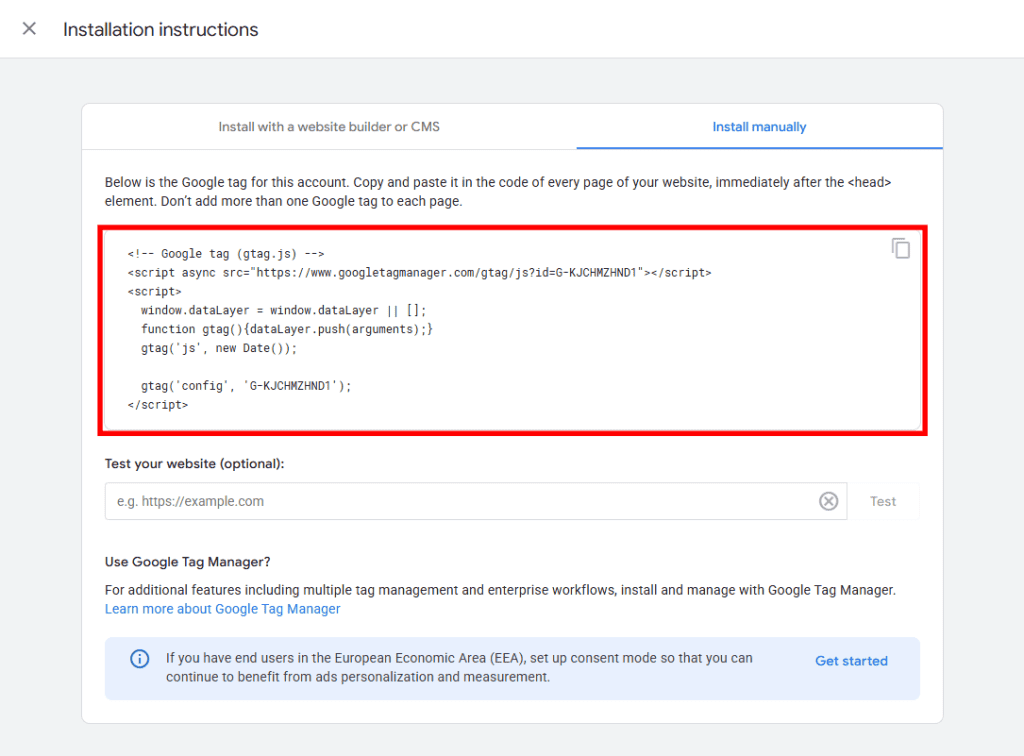
Paste the code within the <HEAD> section of your website. You’ll need to somehow directly edit your theme’s header file, either through your site’s cPanel or FTP.
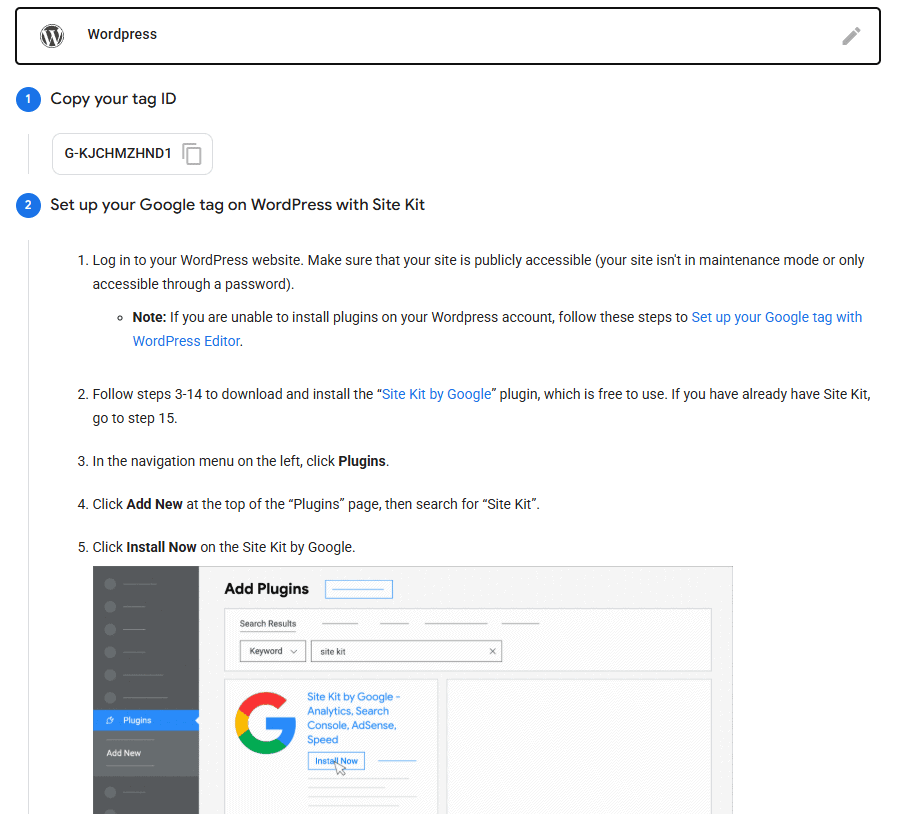
If you’re a WordPress user, we recommend using the Code Snippets plugin. After installing the plugin, visit Snippets > Add New. Paste in the Google tag code, select the Display in site <head> section, and click Save Changes.

Installing with CMS or Website Builder
If you’re using one of the supported content management systems, select the Install with a website builder or CMS tab and click the Select Your Platform button.

Choose your platform from the list and follow the steps to install your Google Tag.
For example, WordPress users will need to install the Site Kit by Google plugin. Google provides detailed steps with images and GIFs to get you started.
Use the field at the end of the instructions to test your website.

Google Analytics Reports
Google Analytics is a complex application. There are countless ways to use it to learn more about your website. How you use it depends on the kinds of data you need to make decisions.
To help you understand how to use Google Analytics, let’s walk through each of the main reports and features.
1. Home
The homepage of Google Analytics 4 gives you a quick overview of what’s happening on your site. It’s a good place to see how your site is doing at a glance.

At the top, you’ll see how many users visited recently, how long they stayed, and what device they used. There’s also a real-time view showing how many people are on your site right now and where they come from. You can change these metrics by clicking the down arrow next to each one.
2. Reports
The Reports section in GA4 is where you find all the detailed info about your visitors, what they do on your site, and how they got there. Everything is grouped by category so you can explore your data easily.
Reports Snapshot
This is your dashboard summary. It pulls in highlights from all your key reports. You’ll see user counts, top traffic sources, best-performing pages, and popular events. It gives you a quick feel for how your site is doing without digging deep.

Realtime Overview
The Realtime Overview page shows you what’s happening on your website right now. It updates live, so you can see where people are coming from, what they’re doing, and what pages they’re on within the last 30 minutes. It’s great for checking if a campaign is working or just seeing activity as it happens.
- Users in the Last 30 Minutes/Last 5 Minutes – A count of active users in real time.
- Active users by source – Shows where your current users came from, like Google, social media, or direct visits.
- Active users by audience – Displays how many active users belong to specific audiences you’ve created, like “returning visitors” or “cart abandoners.”
- Views by page title and screen name – Lists the most viewed pages or screens on your site or app right now.
- Event count – Shows how many total events have happened in the last 30 minutes, like clicks or scrolls.
- Key events – Highlights important actions you’ve marked as conversions, such as purchases or form submissions.

Realtime Pages
Realtime Pages shows a list of the exact URLs (not just page titles) users are actively viewing on your site within the past 30 minutes. It breaks down active users by each page path, letting you see which pages are getting traffic right now and how long users are staying on them. This view is helpful for monitoring live campaigns or spotting sudden spikes in interest.

Acquisition
These reports explain how people are finding your website.
Acquisition Overview
The overview report gives you a top-level look at your traffic sources. You can see how many users came from search engines, social media, paid ads, or direct visits. It’s a good place to compare how different marketing channels are performing.

User Acquisition
This report focuses on new users only. It shows how first-time visitors found your site, like through Google search, Facebook, or a referral link. This helps you understand which channels attract new visitors.

Traffic Acquisition
Unlike user acquisition, this report includes all visits, not just the first one. It tells you where people came from each time they visited. If someone finds your site through Google one day and through email the next, both visits are tracked here.

User Acquisition Cohorts
This report groups users by when they first visited your site. You can then see how each group behaves over time. Do they come back? Do they convert? This helps track long-term performance.

Lead Acquisition
If your site collects leads (such as through form submissions) this report shows how well each source brings them in. It’s helpful for seeing which campaigns bring in quality leads.

Non-Google Cost
This report is for tracking ad spend on platforms other than Google (like Facebook or LinkedIn). You can compare how much you’re spending versus what you’re getting in return.

Engagement
These reports show what visitors do once they’re on your site.
Overview
The engagement overview gives a snapshot of how active and interested your visitors are. It provides key metrics like average time on site, number of engaged sessions, user stickiness, and event count.

Events
Events are actions users take, like clicking a button, watching a video, or submitting a form. GA4 automatically tracks some basic events, but you can set up custom ones too. This report shows how often each event happens.

Pages and Screens
This report lists all the pages users visit (or screens, if you have an app). You can see which pages get the most views, how long people stay, and what they do while they’re there.

Landing Pages
Landing pages are the first pages people see when they arrive on your site. This report helps you find your top entry points and spot which pages bring in traffic that stays and converts.

Monetization
These reports are for websites that sell products or track revenue.
Overview
See your total revenue, purchases, average order value, and more. This is a great place to check how your store is doing overall.

Ecommerce Purchases
This report shows detailed info about each item sold on your ecommerce website, including quantity, revenue, and product name. You can find out what’s selling best and what’s underperforming.

Purchase Journey
This tracks how people go from viewing a product to buying it. You can see how many drop off along the way and where they stop. This is a powerful tool to find holes in your purchase funnel.

Checkout Journey
Checkout journey breaks out each step of the checkout process. If people are abandoning their cart, this helps you figure out where it’s happening so you can fix it.

Promotions
This report shows how your on-site promotions are performing, like banners, pop-ups, or special offers. You can see how often each promo is viewed, clicked, and whether it leads to purchases.

Transactions
This report lists completed purchases, including details like order value, number of items bought, and revenue. It helps you track overall sales performance and see which transactions contribute most to your revenue.

Retention
This report tells you how well your site keeps people coming back. It tracks how often users return after their first visit and how long they stay engaged. If your site depends on return visitors (like a blog or membership site), this is a helpful report.

User Attributes
Ever wonder who visits your site? These reports tell you more about who your visitors are.
Overview
This gives you a quick look at your audience. You’ll see details like country, language, age group, gender, interests, and more.

Demographic Details
The demographic details report gets deeper into user traits such as age, gender, location, and device language. It’s useful for understanding who’s engaging with your content.

Audiences
Audiences are groups of users who meet specific conditions, like “users who viewed a product but didn’t buy.” This report shows how those audiences behave and helps you target them better in ads or campaigns.

Tech
These reports tell you what kind of technology your visitors are using.
Overview
Here you can see a high-level breakdown of devices (mobile, desktop, tablet), browsers, and platforms users are on.

Tech Details
Gives more specific data on things like browser version, operating system, screen resolution, and device category. These are useful for making sure your site works well for your audience.

3. Explore
The Explore section in Google Analytics 4 is where you can dig deeper into your data and create custom reports. Unlike the standard Reports section, which gives you pre-made charts and tables, Explore lets you build your own from scratch.

Here’s what you can do in Explore:
- Create custom reports: Choose your own dimensions (like traffic source or device) and metrics (like users or conversions). You can mix and match data in a way that fits your exact question.
- Use templates: GA4 gives you templates like funnel analysis, path exploration, or segment comparison. These help you see how users move through your site or where they drop off.
- Drill down into specific user behavior: You can filter and break down your data to answer questions like “What did users from Facebook do on mobile last week?” or “Which landing pages bring in high-value customers?”
- Visualize your data: Choose from charts, tables, and graphs to see your insights clearly.
- Export your data: Once you’ve found something useful, you can download your report to share or analyze elsewhere.
4. Advertising
The Advertising section shows how your ads are performing and how they drive conversions. It brings together data from platforms like Google Ads, Display & Video 360, and others, so you can see how different campaigns and channels contribute to results on your site.
Advertising Snapshot
This is your quick overview of ad performance. It highlights top-performing channels, recent conversions, and trends across your ad campaigns.

Attribution
Attribution reports help you understand how different marketing channels work together to drive conversions. Instead of only giving credit to the last click, GA4 shows how users move through multiple touchpoints before converting.
Attribution Paths
This report shows the journey users take across different channels before converting. It might include clicking a Google ad then visiting later from email. You can see common conversion paths and how long they take.

Attribution Models
Here you can compare different models to see how credit is assigned, such as last click, first click, or data-driven. It helps you decide how much credit each channel deserves for a conversion.

Planning
These reports help you track and compare performance across all advertising platforms you’ve connected.
All Channels
Gives you a breakdown of traffic and conversions from every ad channel, such as Google Ads, Facebook, or display ads. It helps you compare performance across the board.

Display & Video 360
If you use Google’s DV360 platform for programmatic ads, this report shows impressions, clicks, and conversion data directly from those campaigns.

Google Ads
This report gives a deeper look into how your Google Ads are performing inside GA4. You’ll see data like clicks, cost, impressions, and how those ads lead to on-site actions and conversions (if you set them up).

Tools
This section gives you controls to manage key parts of your ad setup in GA4.
Conversion Management
Lets you manage which events are counted as conversions. You can add or remove conversion events, which directly affects how ad performance is measured in other reports.

Advertising Segments
Here you can create or view audience segments used for targeting in your ad campaigns. These segments can be shared with Google Ads for more personalized targeting.

How to Use Google Analytics
Once GA4 is set up, the real value comes from knowing where to look and what to track. You don’t need to explore every report, but you should focus on the ones that help you understand your traffic, your content, and your goals.
Here’s how to use Google Analytics in a way that actually helps you grow your site.
1. Set up Conversions (Key Events)
In GA4, you can mark important actions as key events, like clicking a “Buy” button or submitting a contact form. This tells GA4 to treat those actions as conversions, so you can measure what’s working and what leads to results. You can mark built-in events as conversions or create custom ones if needed.
To create an event, click the Admin button on the bottom left and visit Data Display > Events. Use the Create Event button and follow the prompts.

2. Link Google Search Console
By linking Google Search Console to GA4, you get powerful search data directly in your reports. This shows which search terms bring people to your site, how often your site appears in results, and how often people click. This is a great way to track performance of landing pages from search and spot opportunities to improve SEO.
To connect GA4 with GSC, click the Admin button on the bottom left and visit Product Links > Search Console Links. Use the Link button and follow the prompts. You must be a verified owner of your GSC property for this to work.

3. Explore the Engagement Reports Regularly
Go to Reports > Engagement to find out what people actually do on your site. You’ll see time spent, events triggered, and which pages get the most interaction.
The Events report shows things like link clicks or video plays, while Pages and Screens shows which pages get the most views. This helps you find high-performing content and spot weak areas where people leave early.
4. Explore the Acquisition Reports Regularly
Check Reports > Acquisition to understand where your visitors come from. You’ll see whether they arrive from search engines, ads, social media, or direct links.
The User Acquisition report shows how you’re attracting new users, while Traffic Acquisition covers all visits. This helps you figure out which marketing channels are worth your time.
5. Create and Use Audiences
In GA4, you can build custom audiences based on user behavior. For example, you might create an audience of “people who added to cart but didn’t check out” or “returning visitors from Canada.”
You can then analyze how these groups behave or send them targeted ads through Google Ads. It’s a good way to personalize your strategy and track how specific groups convert.
You have two options for creating an audience:
- Preconfigured Audiences are segments already made by GA4 based on common criteria like behavior, technology, or demographics.
- Custom Audiences let you fully customize your audience based on any of GA4’s filters.
To create an audience, click the Admin button on the bottom left and visit Data Display > Audiences. Click the Create Audience button at the top (not pictured in the following image).

6. Segment Your Data with Comparisons
In any report, you can click “Add Comparison” to break down the data. For example, compare mobile vs. desktop users, or paid traffic vs. organic traffic. This gives you a clearer picture of how different user groups behave so you can make better decisions for each segment.
7. Set Up Email Alerts and Dashboards
While GA4 doesn’t offer built-in email alerts like the old version, you can connect it to Looker Studio (formerly Data Studio) or other third-party tools to build custom dashboards and email alerts. These let you track traffic spikes, conversion drops, or anything else you care about so you don’t have to log in every day.
8. Customize Your Reports
You can adjust which reports appear in your GA4 menu by using the Library section. This lets you remove reports you don’t use and add ones that are more relevant. A clean setup helps you focus on the data that actually matters.
Google Analytics FAQs
Is Google Analytics completely free?
Google Analytics 360 is the paid, premium version of Google Analytics made for large businesses. It offers more data and deeper insights than the free version. With 360, you get higher data limits, unsampled reports, better integration with other Google products, and dedicated support.
How does Google Analytics track users?
Google Analytics tracks users by adding a small piece of code to your website. When someone visits your site, that code collects info like pageviews, clicks, and time spent, then sends it back to your Google Analytics account.
Is Google Analytics easy to learn?
GA4 has a bit of a learning curve, especially if you’re new to analytics. But once it’s set up, the basic reports are easy to understand and use without needing technical skills.
How accurate is Google Analytics data?
Google Analytics is generally reliable for trends and patterns, but the numbers aren’t perfect. Ad blockers, cookie restrictions, and privacy settings can prevent data from being tracked.
How long does it take for Google Analytics to start showing data?
Data usually starts showing up in your reports within a few minutes after setup. You can check the real-time report to see if your tracking is working right away. Keep in mind that GA4 can not show you data from before you integrated it with your site.
How to practice using Google Analytics?
Google offers a free demo account with real data you can explore anytime. You can also install GA4 on a test website to get hands-on experience.
How to make the best use of Google Analytics?
Focus on tracking what matters most for your goals, like signups, purchases, or traffic sources. Check your reports regularly and use the insights to improve your content, speed, and user experience.
Wrap Up
Most people install Google Analytics and never look at it again. But if you take the time to set it up properly and check a few key reports, you’ll gain a lot of useful information about your site. Focus on the basics, track what matters, and use the insights to make better decisions for your site.
Ready to build your WordPress site?
Try our service free for 14 days. No obligation, no credit card required.


