

Network troubleshooting is important for all website managers. In this tutorial I will explain what Traceroute is and explain how to use this tool.
Discovering the cause of network problems can be tricky. If you have experienced connection problems with your website and have opened a new support ticket, we may ask you to provide us with the results of a scan with Traceroute.
Table of Contents
What is the Traceroute
Traceroute is a diagnostic tool that uses the ICMP protocol to trace the network path between two devices. It is commonly used to identify connection problems and you can find it, most of the times, already integrated in your operating system.
Compared to other diagnostic tools, it differs in that it examines how data moves through the Internet.
When Traceroute is executed, Internet packets are sent in succession to the target.
Before reaching the destination host, packets pass through multiple devices (gateways). Each step taken by a packet is called a hop.
By gathering information from packets passing through the network, this tool tries to determine what is the entire network path (route) between two devices.
How it helps reveal network problems
Traceroute, in addition to mapping the network path also tracks the time it takes for each packet to reach its destination and return.
If there is a connection problem between two devices, with this tool you can find out where a packet was interrupted in its path.
The following is a list of some of the causes that may interrupt the smooth transit of packets.
- Blocked IP or destination unreachable
- Connection timeout
- Host configuration errors
- Connection interrupted by a Firewall
- Routing loop
Run Traceroute on Windows
To run a Traceroute on Windows you can use the “tracert” command from the Command Prompt or install a specific program.
We recommend using PingPlotter software because it is easy to use and has some interesting features that can provide a more detailed overview of the situation.
You can download a trial version of the program by connecting to the official PingPlotter website.

After downloading and installing the program, you can open it by typing “PingPlotter” in the Windows Start menu.
The interface of the program is quite intuitive. In the top bar you’ll be able to enter the IP, hostname or URL of the website you want to check. Once you have defined the destination, you’ll have to press on the green arrow to run the Traceroute.

As you may notice, a number of IP addresses have appeared. All of these addresses represent the network path between your device and the address you typed in.
From the program screen, you can see the number of hops.

Next to the number of hops it is possible to visualize the IP of the host, that is the device that manages the network communication.

If available, the hostname associated with each IP address will be displayed.

Finally, all information about the packet transmission time will be displayed.

Export results
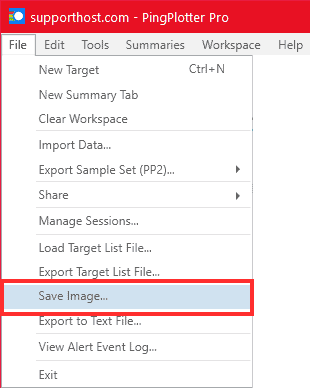
You can export an image containing the results obtained by selecting the menu File → Save Image, saving the generated file in the folder of your choice.
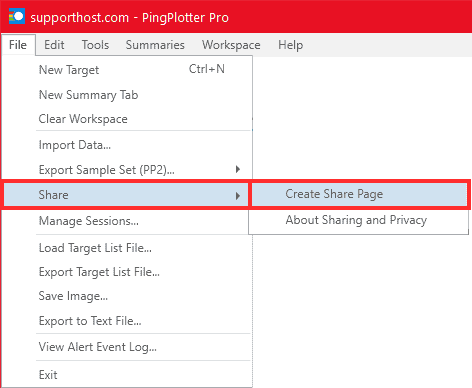
Another way to export the result of the Traceroute scan is to open the program’s menu and select File → Share → Create Page Share.
This will immediately generate a web page with all the details of the scan.
You will be able to share the report by copying the link from your browser’s address bar or by using the share buttons.

Run Traceroute with Mac
To run a Traceroute on MacOS you can use the network utility included in the operating system, use the appropriate terminal command or install a specific program.
We recommend using the PingPlotter program because it provides more detailed results. To download it, go to the PingPlotter site and press “Download“.

After downloading and installing the program, open it using Mac’s “Launchpad”.

Once you open PingPlotter, you’ll find yourself in front of its main screen.

To run Traceroute, type an IP, hostname, or URL into the top bar and press the green arrow.

You will see all the hops and other information regarding the submitted packets.

Generate a report
The quickest way to create a session report is to take a screenshot by clicking File → Save Image.

Select the location where you want to save the newly generated image and press the “Save” button to finish the operation.

Alternatively, you can share the results obtained by generating an online page, which will contain several sharing options, using the menu File → Share → Create share page.

Run Traceroute from your smartphone
Unlike Windows and Mac operating systems, on mobile devices there is no built-in tool to run a Traceroute scan.
In order to perform Traceroute from mobile devices, you necessarily need to install an app from your reference store or from the web. There are plenty of options to choose from on the market, both free and paid, which include several additional features.
Traceroute with Android
You can use Traceroute on Android by downloading applications from Google PlayStore on your smartphone. To run Traceroute on Android we recommend using Best Trace, but there are many alternatives that are just as good.
Best Trace is a completely free program. To install it, search for the Best Trace app on the PlayStore and press the “Install” button.

After downloading and opening the program, to run Traceroute you will need to enter the IP or hostname of your website in the only empty field present.

You will see all the hops and response times of the sent packets. You can save or share your results by clicking on the “Share” button.

From the screen that opens, you’ll be able to choose how to export and share the results.

Traceroute with iPhone and iPad
You can run a Traceroute scan from your iPhone and iPad by downloading PingPlotter from the App Store.

After installing and opening the app, enter your IP or website address and press “Trace” to start the utility.

You’ll be asked to give the application the necessary permissions to work, confirm this by pressing Ok.

At this point, you’ll see a range of IP and other packet transmission time information.
To share your results press the middle button in the top bar.

You can choose how you want to save your results. Select “Collect data PP2” to export all collected information.

Email us the results so we can analyze them to provide you with a solution to your problem.

How to read the results
Using Traceroute you can usually derive this information:
- Number of hops
- Round Trip Time (RTT) is the time, expressed in milliseconds (ms), it takes for a packet to reach its destination and return.
- Node IP
The first hop shown in a Traceroute result provides information about the first router, which would be on your local area network (LAN). Subsequent hops provide data about your Internet Service Provider (ISP) routers.
The remaining intermediaries, are routers and network switches from which the packets travel. The last hop represents the final destination, i.e. the purpose set by the user.
By analyzing all this information, you can identify the source and cause of some network problems.
Controls latency
The time it takes for data to travel to its intended destination and back is called “latency,” and if the values are excessive, it can be an indicator of a network problem.
High latency is a red flag, but it does not necessarily indicate that there is a problem. Packet transmission times can be affected by many factors, such as:
- Physical transmission medium in which the signal is routed
- Distance
- Number of intermediate hops
- Traffic levels
- Server speed in processing response times.
To solve distance issues between devices, you can use a CDN service like Cloudflare. You can enable Cloudflare on your hosting plan by purchasing an addon.
Check for packet loss
Some tools allow you to track Internet packet loss (packetloss). The packetloss is the difference, expressed as a percentage, between the number of packets sent and the number of packets received.
Packet loss can have multiple causes and it is difficult to trace the source of the problem, but it is important to know where it occurs. In the image below you can see an example.

Using a wifi connection to run your tests may result in packet loss. Make sure to run your tests under stable network conditions.
Analyze the entire network path
If you’re experiencing connection problems with the last host but don’t have a clear idea of what’s going on, you should check the entire network path for anomalies between hops.
If the packets do not go beyond the first hop, you are most likely facing a problem with your local network.
